Network Topology
The network topology dashboard displays a visual representation of your network, showing connections and device information for all monitored nodes. The view allows you to understand your network’s architecture at a high-level, but also lets you isolate individual devices or subsections of your topology.
Access the Topology View
To open the topology view, click ![]() Topology in the workbench header. Use the dropdown in the header to display your network topology in one of two ways:
Topology in the workbench header. Use the dropdown in the header to display your network topology in one of two ways:
- Logical grouping (beta): Visualize the topology according to the system labels assigned to the switches.
- Role-based grouping: Visualize the topology according to the roles assigned to the devices.
Logical groups correspond to system labels that you assign to switches using NVUE commands. After you configure the labels, NetQ groups and displays devices according to their assigned labels. NetQ supports four system labels, which are configured at the switch level:
- Device types (
switch_type): choose fromleaf,spine, orsuper_spine - Rail groups (
rail_group_index): vertical groups comprising spine and leaf switches - Scalable units (
su): host devices. You cannot configure labels on hosts, so the placement is based on the most recently discovered LLDP connection to the leaf switches - Pods (
pod): made up of rail groups and scalable units
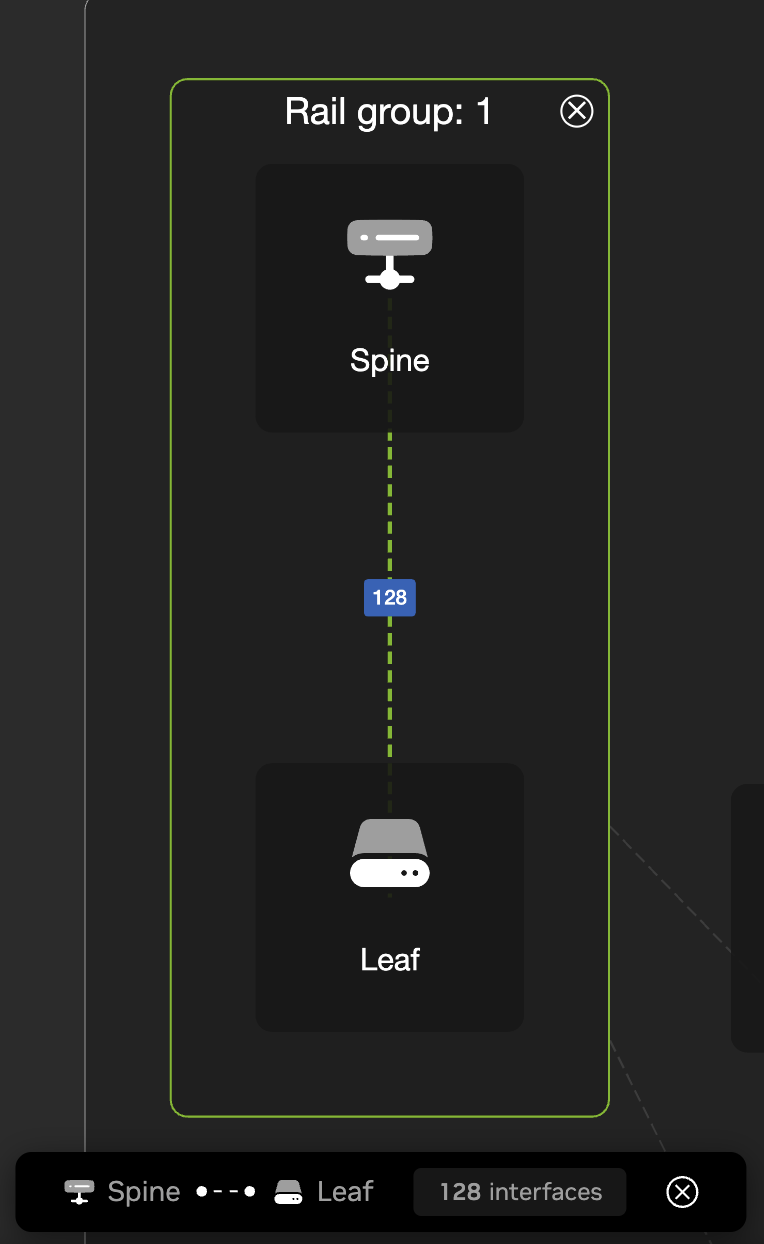
For example, this topology displays a pod labeled Pod:0. Within Pod:0, there are four total rail groups and two scalable units. Rail group:2 is fully expanded to show the spine and leaf switches that comprise the rail group. The dashed lines represent logical links between devices. Select Show physical interfaces to display the physical links as solid lines. The number represents an aggregate count of physical interfaces between the devices of the selected groups. Select More details to isolate the links and view their connections in greater detail.
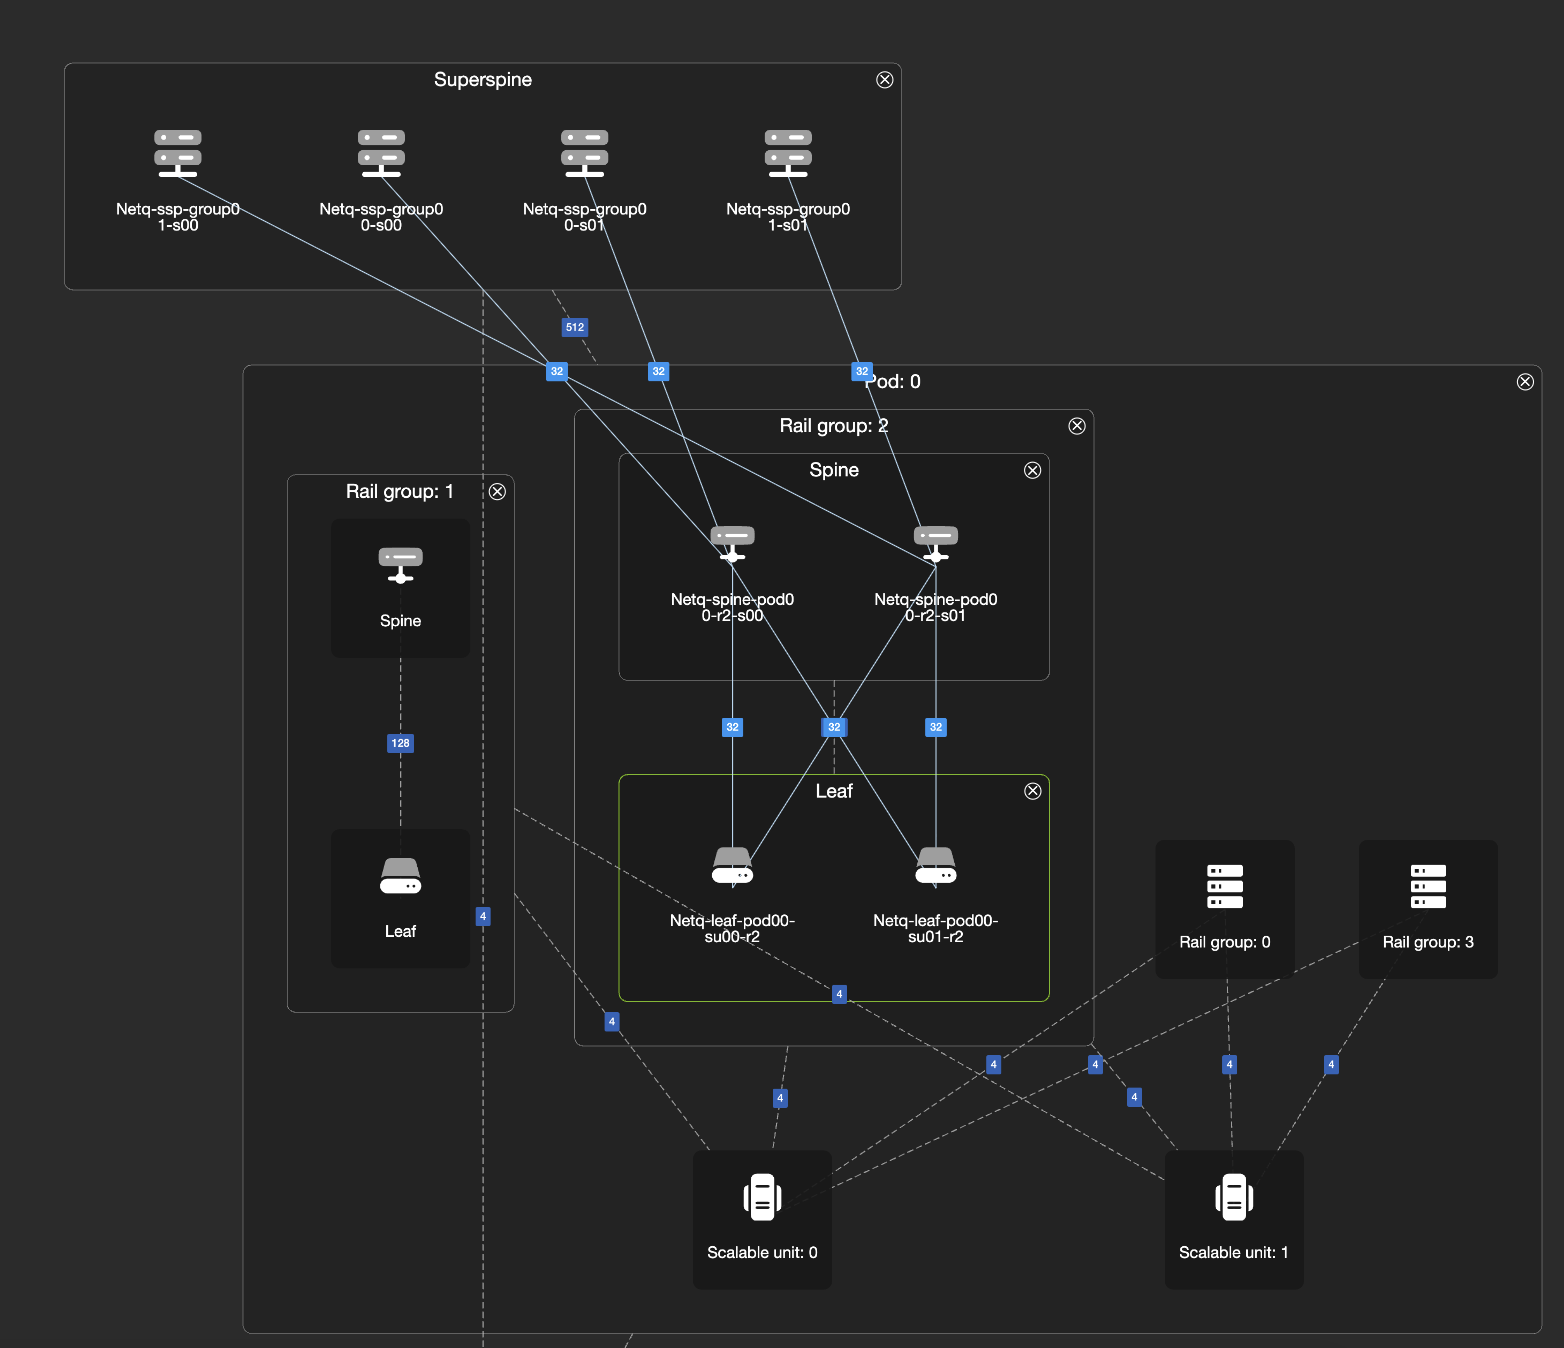
When you hover your cursor over the interface number, NetQ displays the source and target destinations along with the total number of interfaces between them.
Devices that are designated “Unclassified” are not fully configured or are unmanaged devices. The side menu displays a numerical count of the physical devices within the container that you’ve selected. You can select any of the options in the side menu to zoom in on a particular subsection of the topology. Select the eye icon to alternately show or hide a particular device or group of devices.
You can view devices and interfaces at the most granular level by either selecting them until they load in the focused view, or by entering the device’s name in the topology search field. From here, you can see information for the selected device, including ASIC and operating system, protocols, labels, events, and other utilization data related to that device.
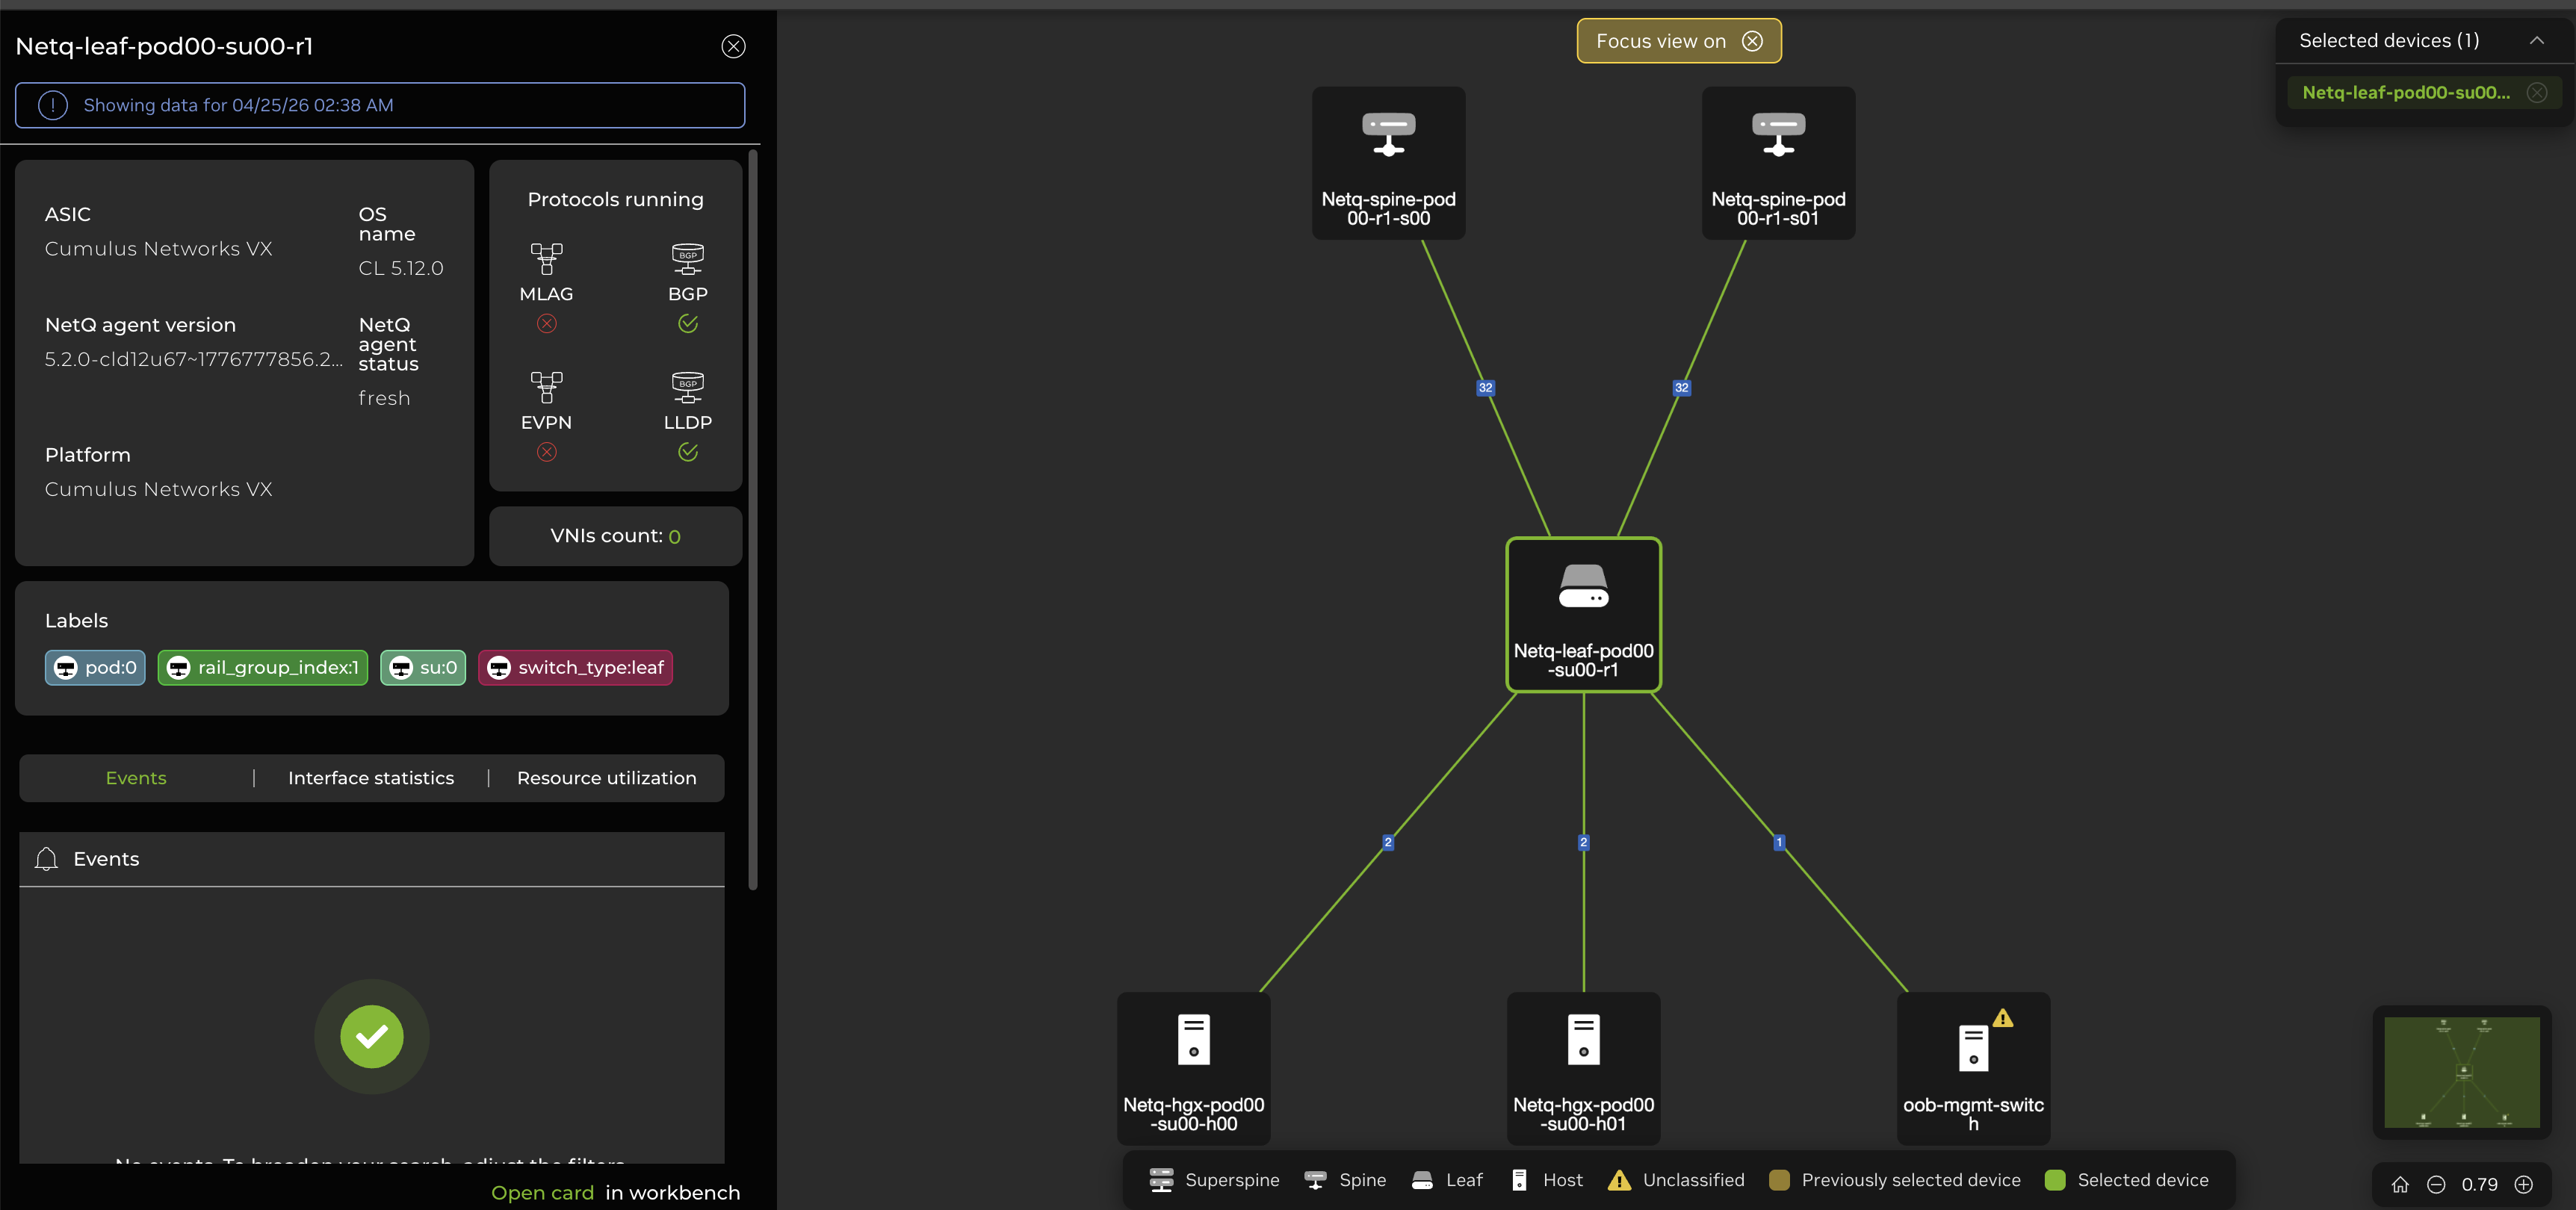
You can select up to 15 devices in focused view; NetQ displays both the selected devices and their connections to other devices, even if they are not among the selected devices.
Select Save view and enter a name to save the focused view as it appears on your dashboard. You can access this view later by navigating back to the topology, then selecting View options and then Saved views. Only fresh switches appear; if you decommission a switch in a saved view, it will no longer appear when you navigate back to the saved view.
You can also export or share an entire topology or a subset of the topology. Select Share to copy a link to your clipboard that you can share with other users. Select ![]() Export to export the topology as an image or as a full topology file (either JSON or Dot format). The Dot file is compatible with and can be used by NVIDIA DSX Air for network simulations.
Export to export the topology as an image or as a full topology file (either JSON or Dot format). The Dot file is compatible with and can be used by NVIDIA DSX Air for network simulations.
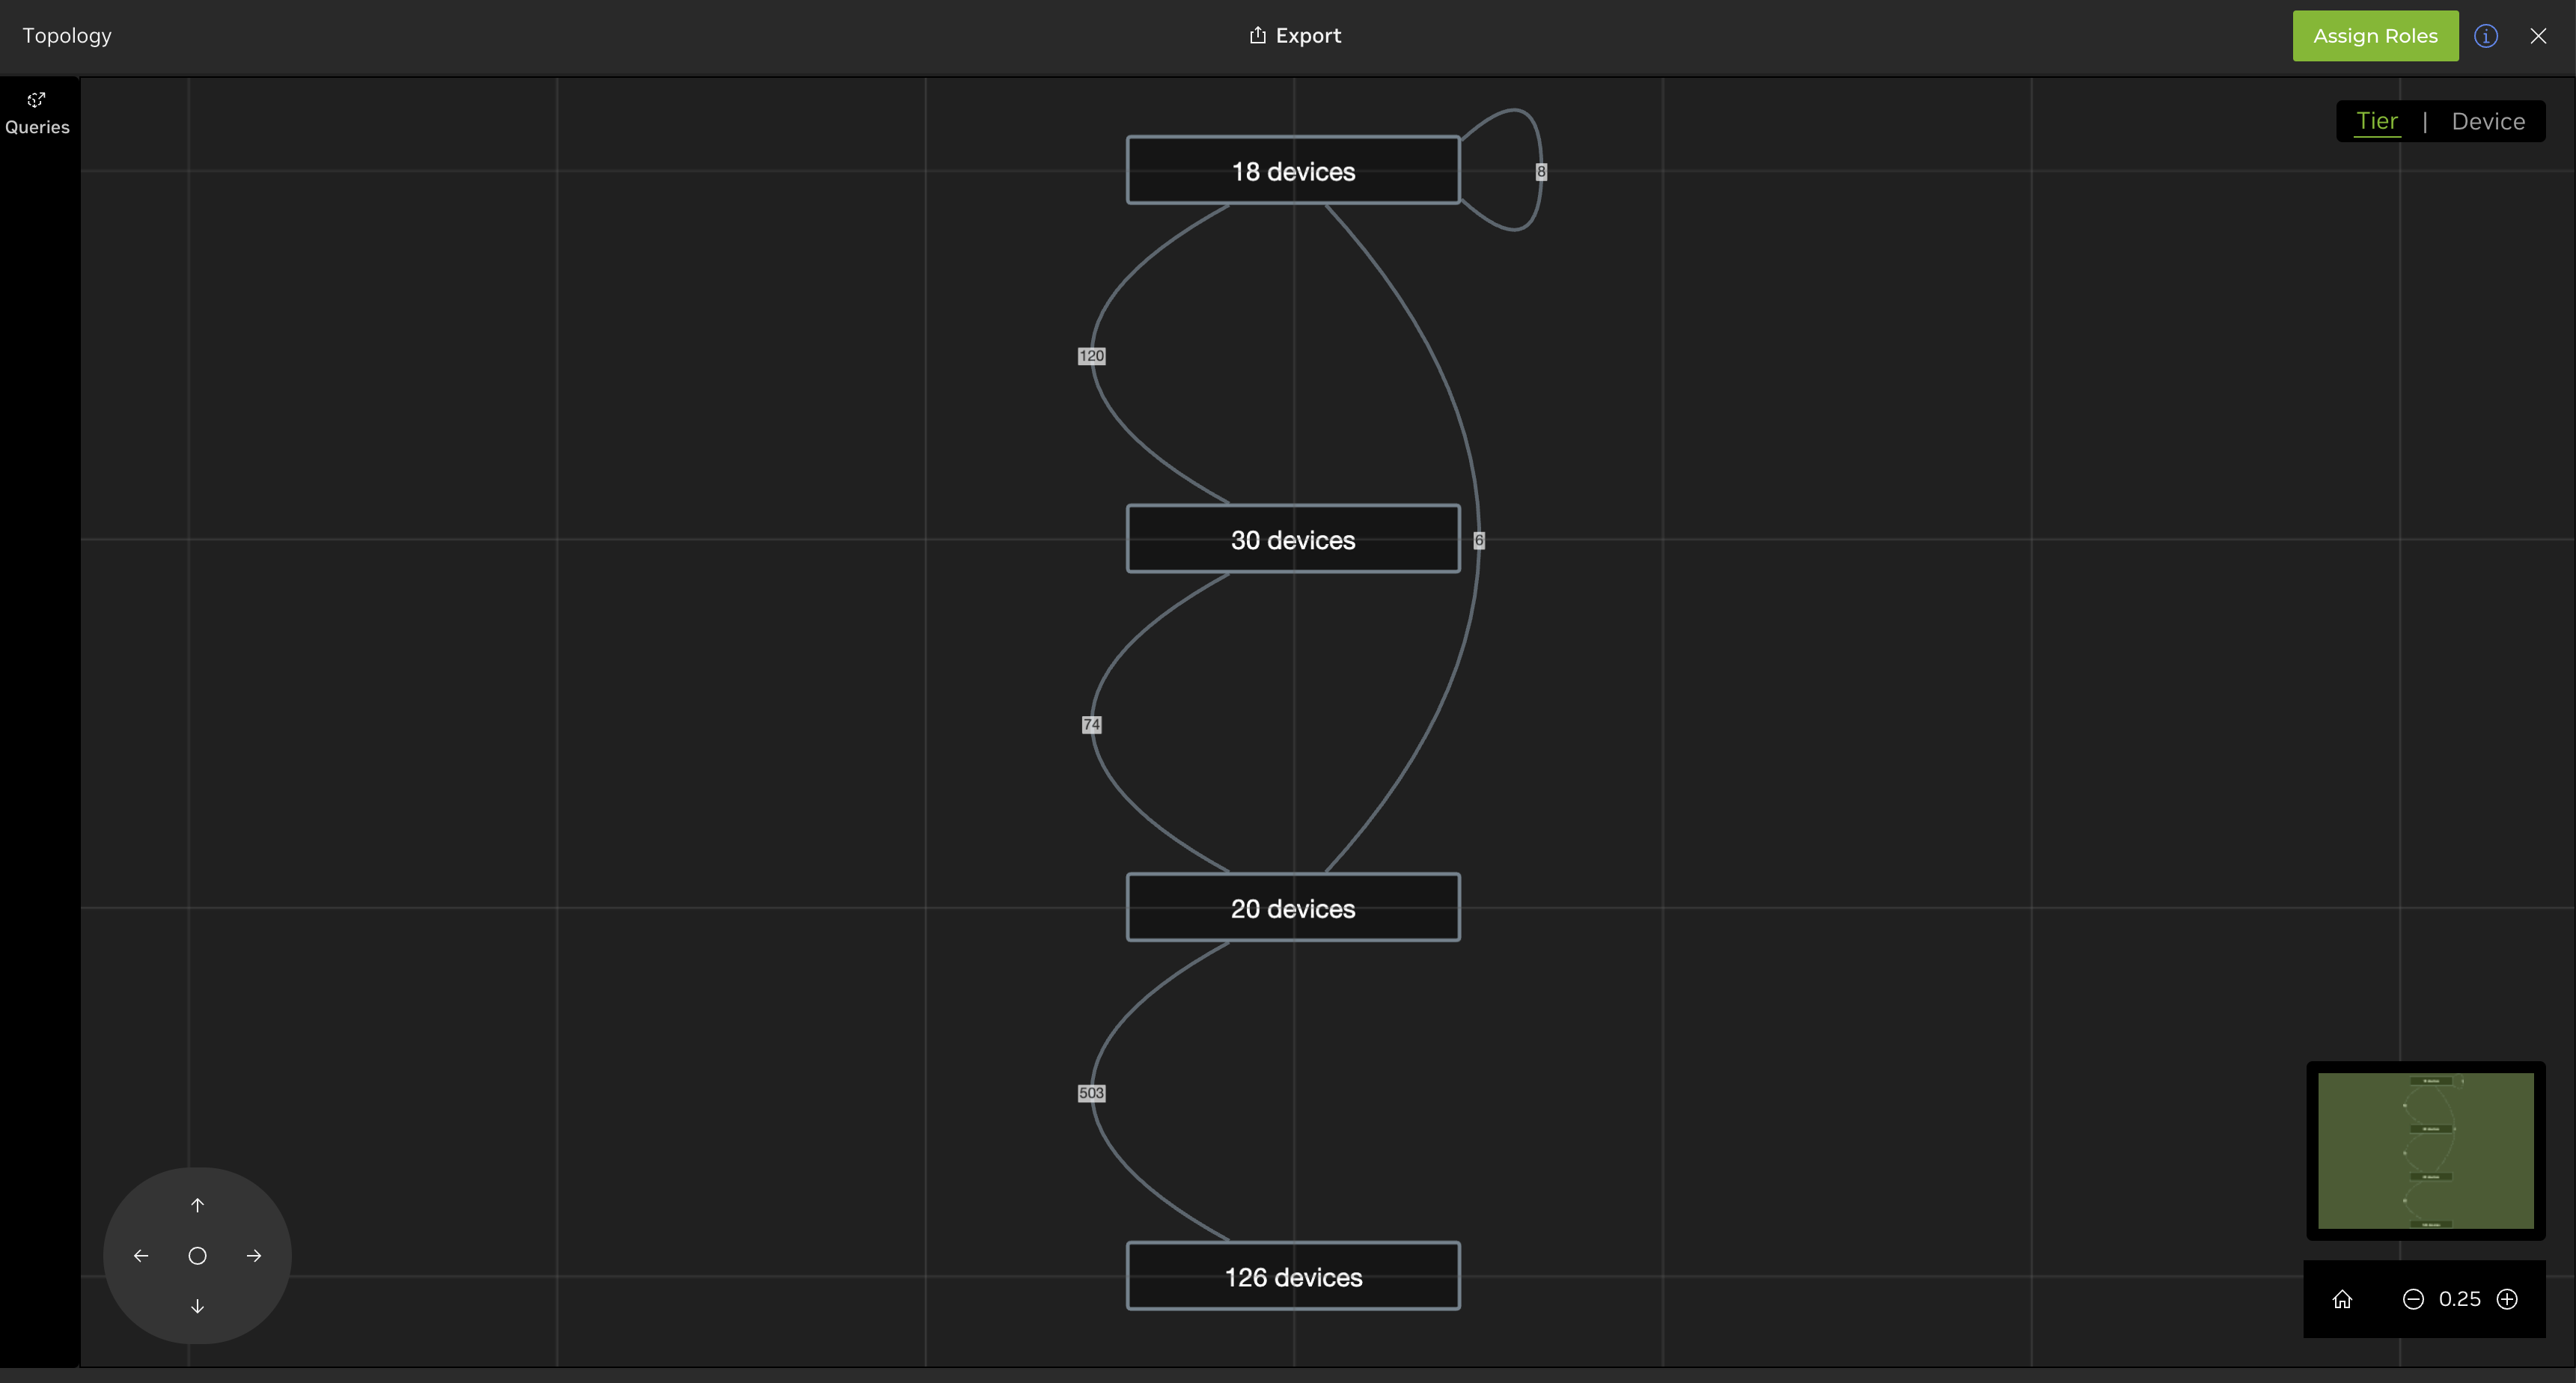
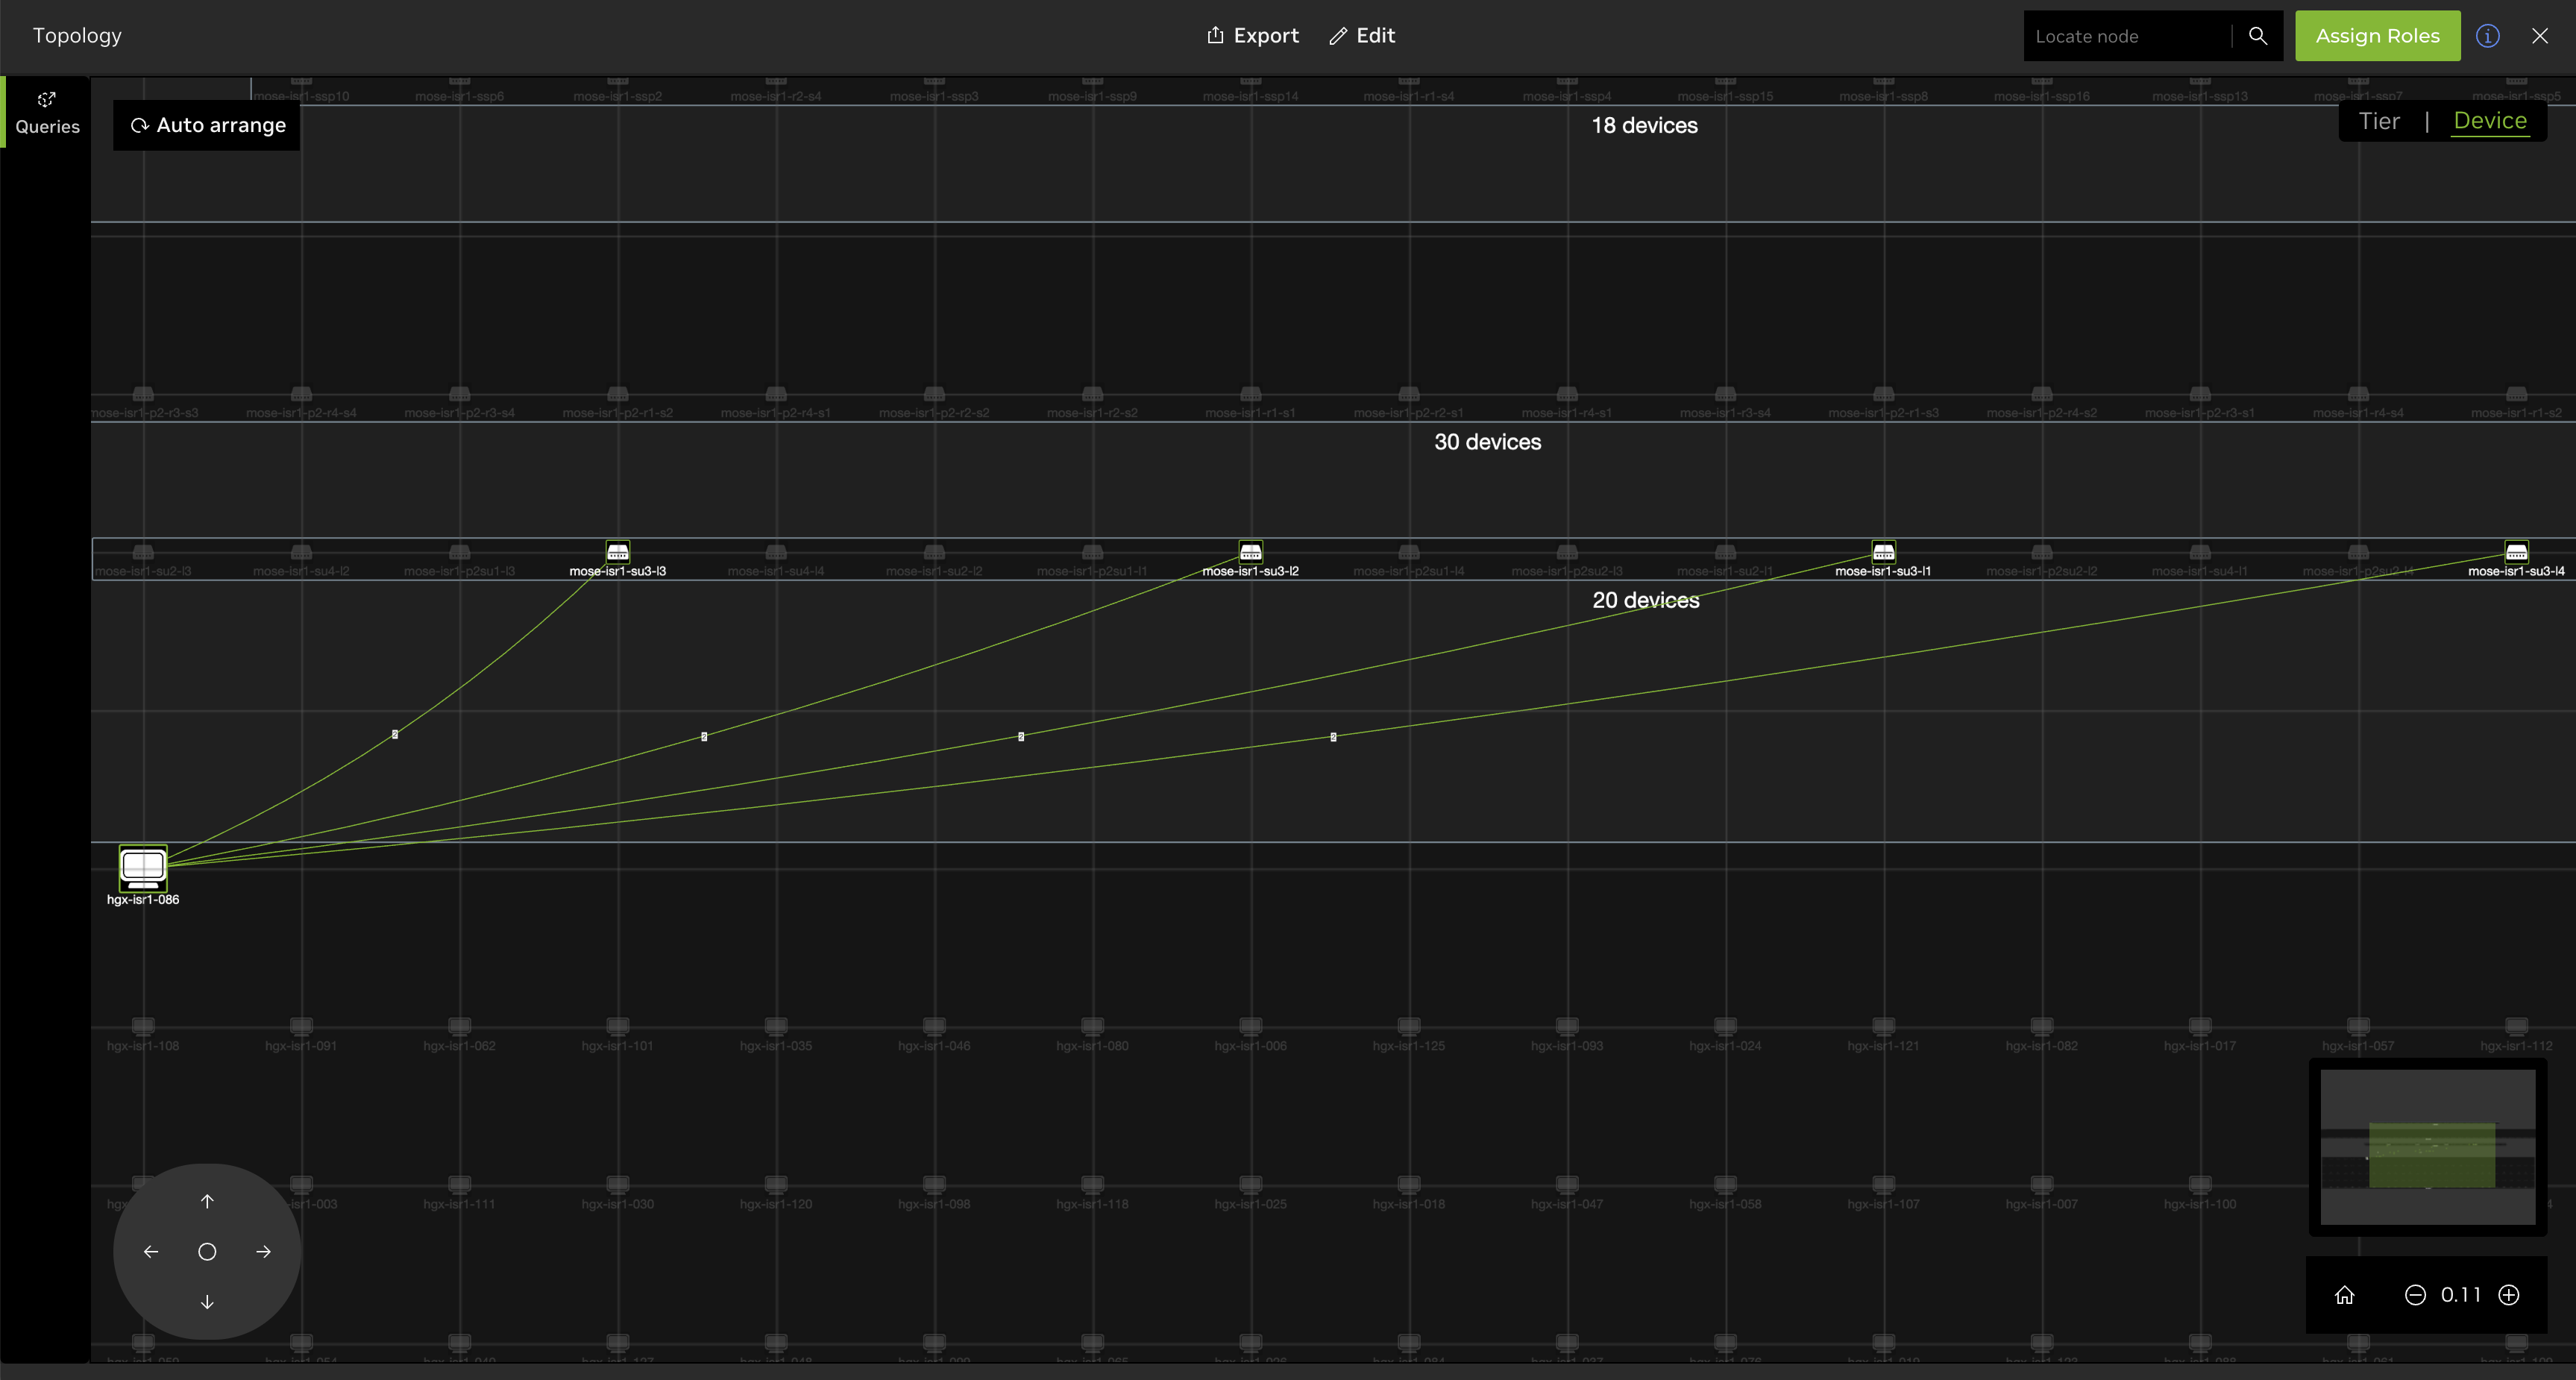
The UI displays the highest-level view of your network’s topology, showing devices as part of tiers corresponding to your network’s architecture: a two-tier architecture is made up of leaf and spine devices; a three-tier architecture is made up of leaf, spine, and super-spine devices. The bottom-most tier is reserved for devices which do not have a role assigned to them.
The Tier view displays connections between devices. The Device view displays connections between the switch ports of different devices. For example, if a device has 32 of its ports connected to 32 ports on another device, the Device view will display a link count of 32. However, in the Tier view, it is represented as one link.
If your devices appear as a single tier, navigate to the device tab and select the Assign roles button. Select the switches to assign to the same role, then select ![]() Assign role above the table and follow the steps in the UI.
Assign role above the table and follow the steps in the UI.
For large networks with many devices, you can assign roles in batches by selecting Bulk assign role and creating rules based on device hostnames.
After assigning roles to the switches, return to the topology view and select Auto arrange to clean up the view.
Interact with the Topology
The topology screen features a main panel displaying tiers or, when zoomed in, the individual devices that comprise the tiers. You can zoom in or out of the topology via the zoom controls at the bottom-right corner of the screen, a mouse with a scroll wheel, or with a trackpad on your computer. You can also adjust the focus by clicking anywhere on the topology and dragging it with your mouse to view a different portion of the network diagram. Above the zoom controls, a smaller screen reflects a macro view of your network and helps with orienting, similar to mapping applications.
View Device and Link Data
Select a device to view the connections between that devices and others in the network. A side panel displays additional device data, including:
| Node Data | Description |
|---|---|
| ASIC | Name of the ASIC used in the switch. A value of Cumulus Networks VX indicates a virtual machine. |
| NetQ Agent status | Operational status of the NetQ Agent on the switch (fresh or rotten) |
| NetQ Agent version | Version ID of the NetQ Agent on the switch |
| OS name | Operating system running on the switch |
| Platform | Vendor and name of the switch hardware |
| Protocols | Protocols running on the switch |
| VNIs | Count of virtual network identifiers (VNIs) on the switch |
| Interface statistics | Transmit and receive data |
| Resource utilization | CPU, memory, and disk utilization |
| Events | Warning and info events |
Select a link connection to open a side panel with additional configuration data, which can be sorted by link pairs.
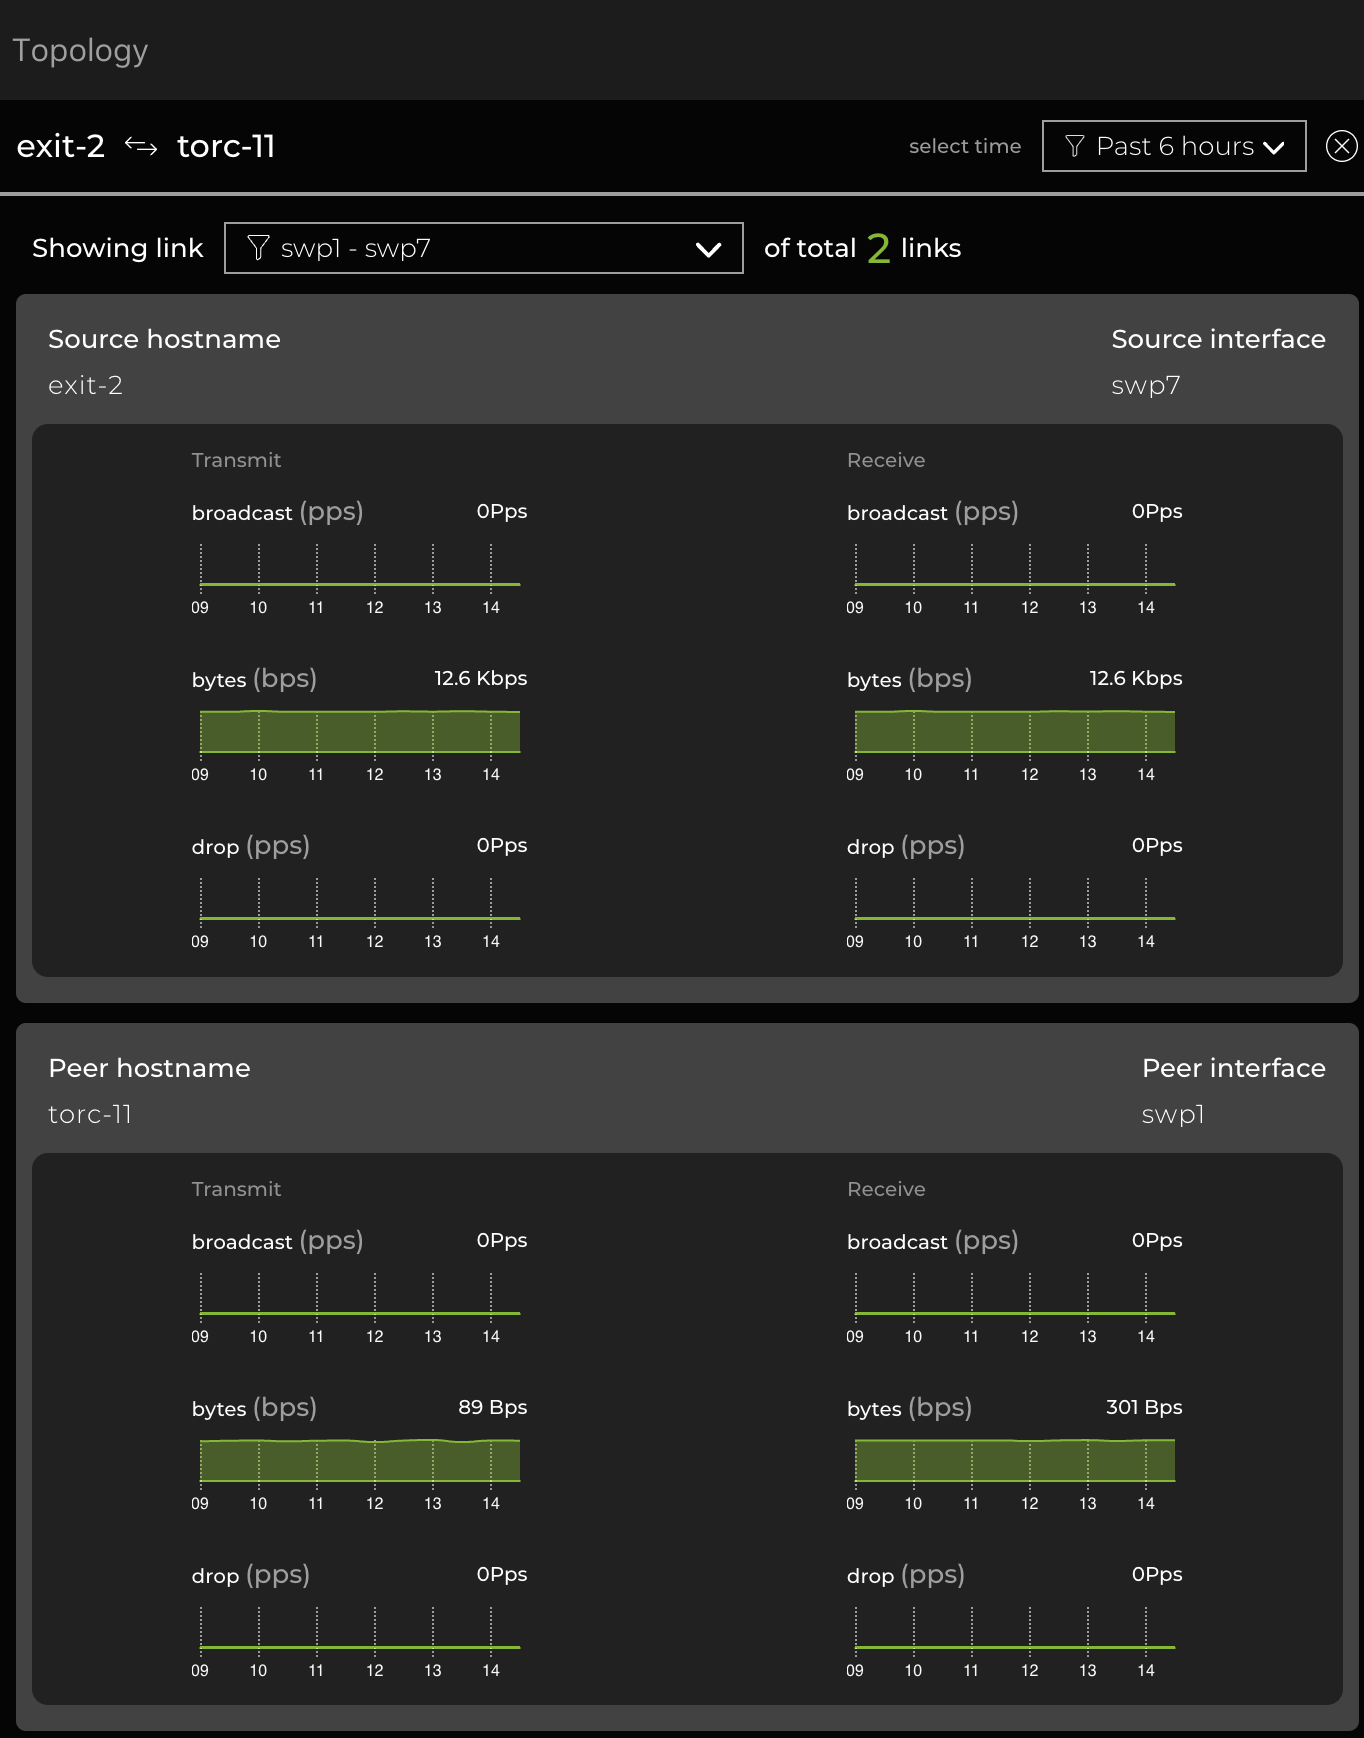
From the side panel, you can view the following data about links:
| Link Data | Description |
|---|---|
| Source hostname | Switch where the connection originates |
| Source interface | Port on the source switch used by the connection |
| Peer hostname | Switch where the connection ends |
| Peer interface | Port on the destination switch used by the connection |
Rearrange and Edit the Topology
You can rearrange the topology’s tiers by selecting Edit at the top of the screen and dragging the tiers into different positions. Click Save to preserve the view or Reset to undo the changes.
Create Queries to View a Subset of Devices
You can create queries to segment a topology into smaller, more manageable parts. This can be especially helpful when you need to view a particular section of a very large topology or when you want to find and view connections between two or more devices. To create a query, select Queries on the left side of the screen (or View options and then Queries), then Add query.
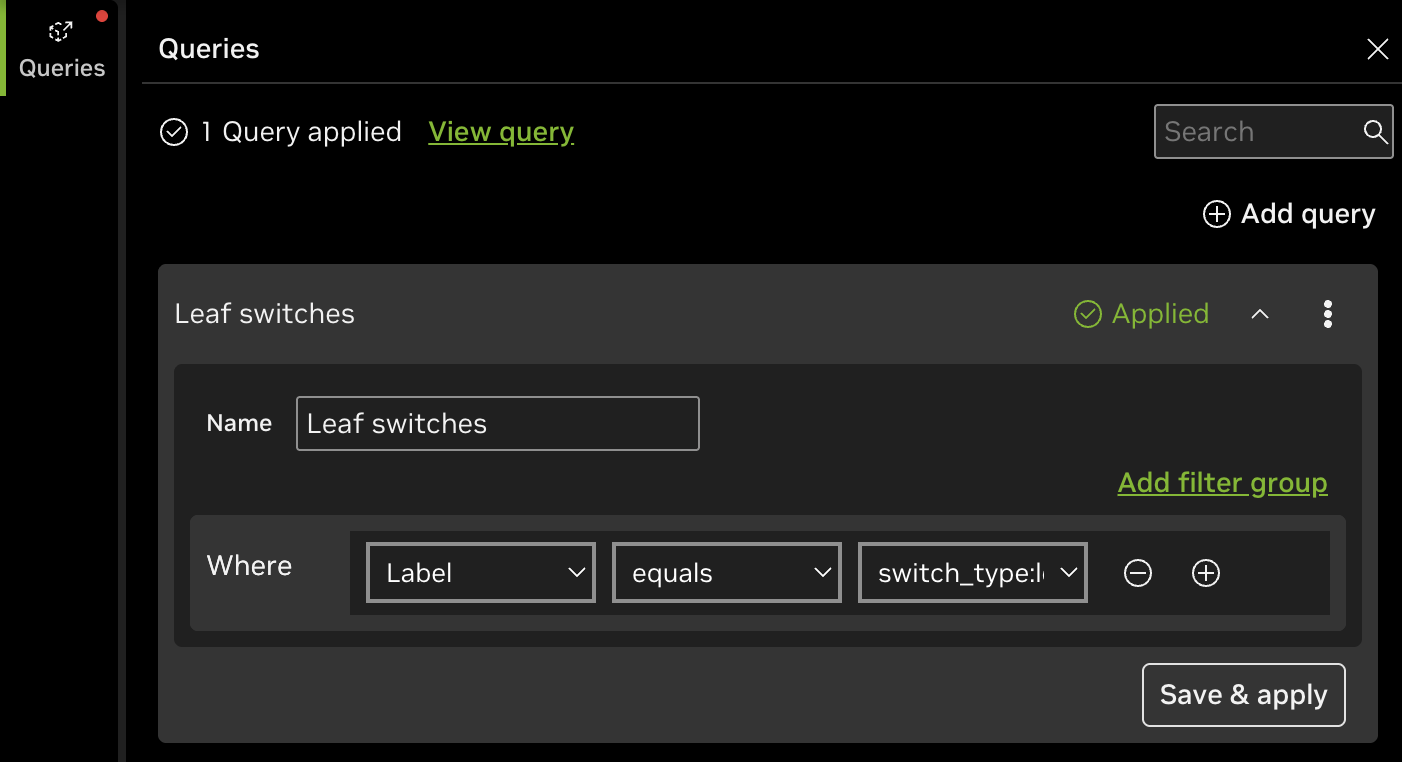
You can create queries based on device hostnames or labels. In the role-based topology, you can combine multiple queries with logical operators by selecting Add filter group. Select the three-dot menu on a given query to either delete or remove the query.