NVLink4 Events
View events generated by NVLink devices and NetQ in the events dashboard. The dashboard displays LFM and GFM status events, events related to the health of NVLink switches, and the severity levels of those events. The dashboard also displays timestamp data and ASIC IDs to help with troubleshooting. The dashboard updates every 60 seconds.
Monitor Events in the UI
Expand the ![]() Menu, then select Events. The dashboard presents a timeline of events alongside the devices that are causing the most events. Select the NVL4 tab to view events related exclusively to NVLink devices.
Menu, then select Events. The dashboard presents a timeline of events alongside the devices that are causing the most events. Select the NVL4 tab to view events related exclusively to NVLink devices.
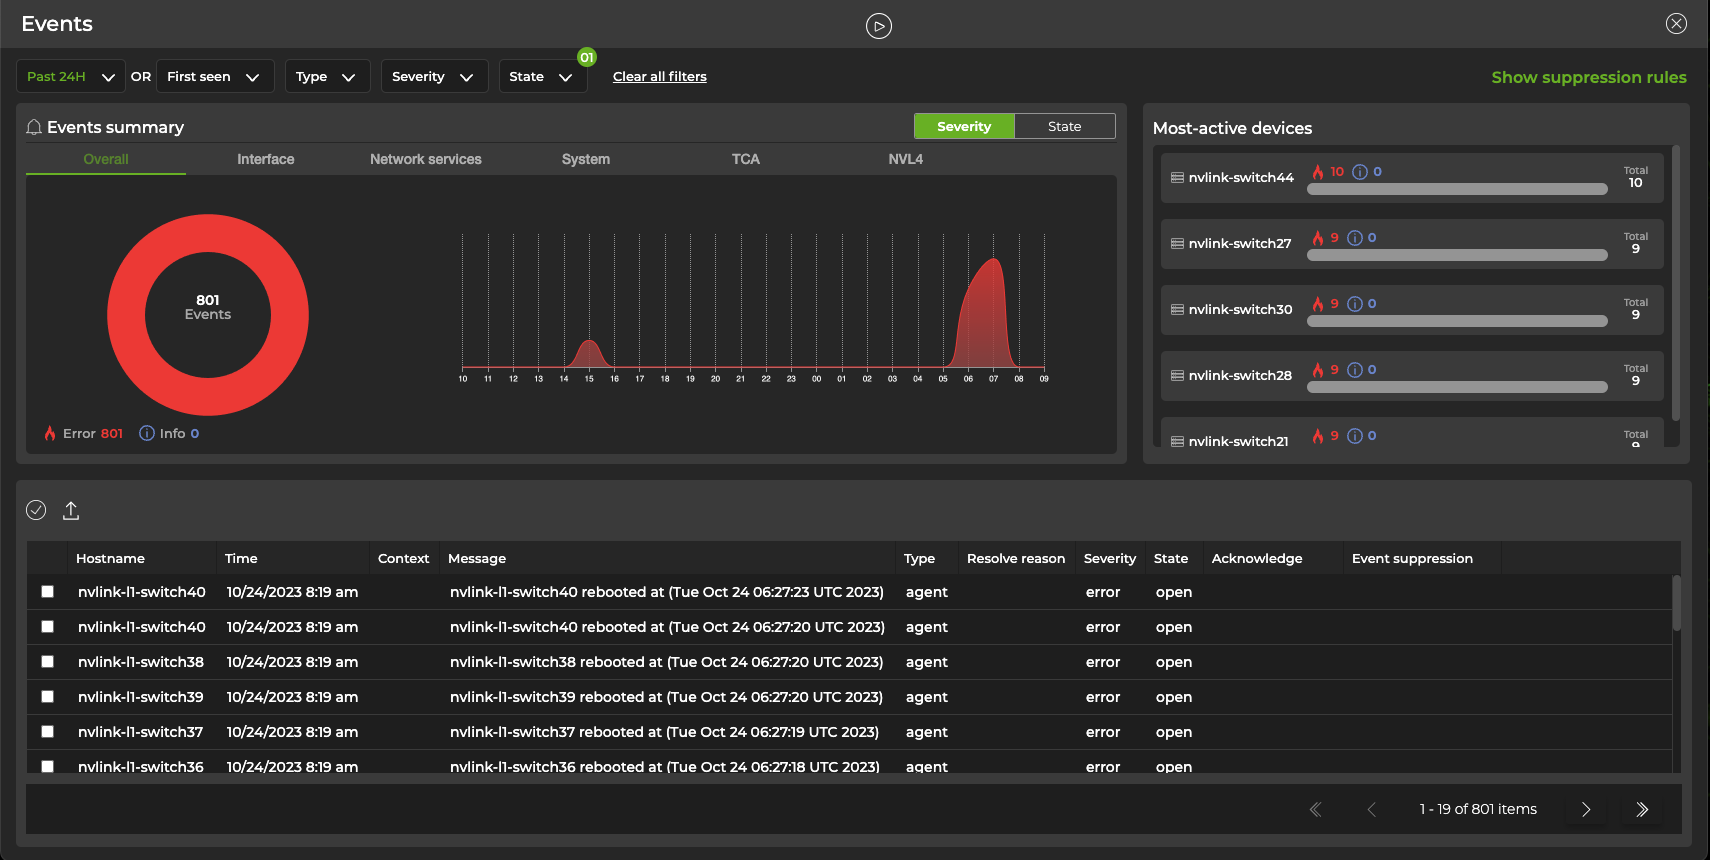
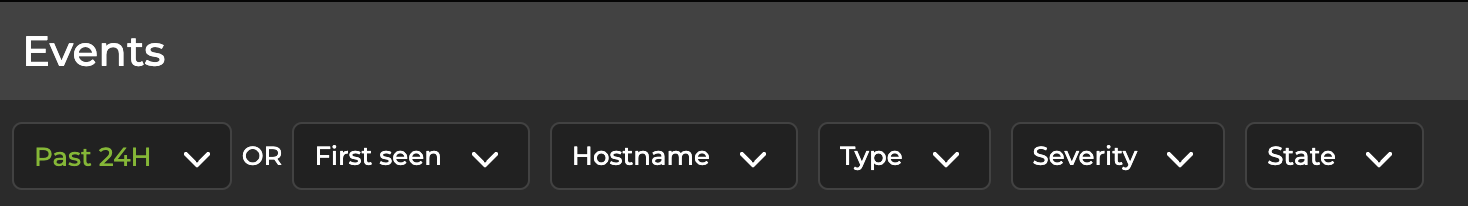
Use the controls above the summary to filter events by time, device (hostname), type, severity, or state.
Related Information
To learn more about the types of events generated by NetQ and how to manage those events, see Events and Notifications.