NetQ Operation
In either in-band or out-of-band deployments, NetQ offers networkwide configuration and device management, proactive monitoring capabilities, and network performance diagnostics.
The NetQ Agent
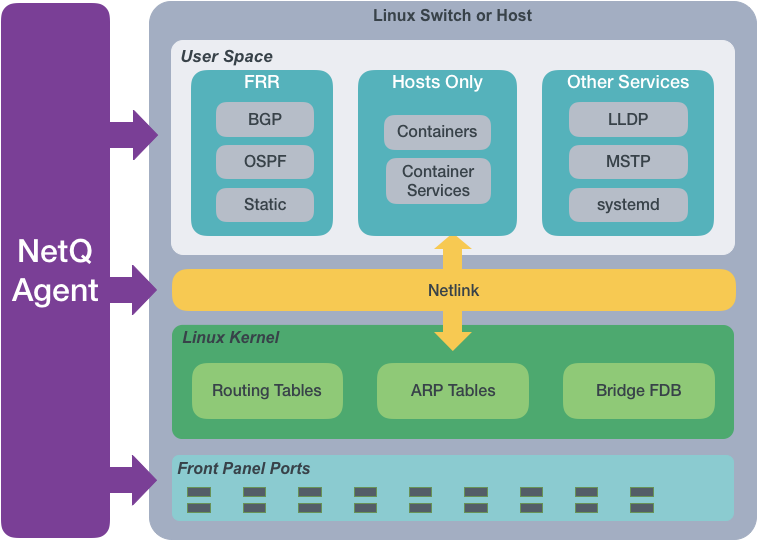
From a software perspective, a network switch has software associated with the hardware platform, the operating system, and communications. For data centers, the software on a network switch is similar to the following diagram:

The NetQ Agent interacts with the various components and software on switches and hosts and provides the gathered information to the NetQ Platform. You can view the data using the NetQ CLI or UI.
The NetQ Agent polls the user space applications for information about the performance of the various routing protocols and services that are running on the switch. Cumulus Linux supports BGP and OSPF routing protocols as well as static addressing through FRRouting (FRR). Cumulus Linux also supports LLDP and MSTP among other protocols, and a variety of services such as systemd and sensors. SONiC supports BGP and LLDP.
For hosts, the NetQ Agent also polls for performance of containers managed with Kubernetes. This information is used to calculate the network’s health and check if the network is configured and operating correctly.
The NetQ Agent interacts with the Netlink communications between the Linux kernel and the user space, listening for changes to the network state, configurations, routes, and MAC addresses. NetQ sends notifications about these changes so that network operators and administrators can respond quickly when changes are not expected or favorable.
The NetQ Agent also interacts with the hardware platform to obtain performance information about various physical components, such as fans and power supplies, on the switch. The agent measures operational states and temperatures, along with cabling information to allow for proactive maintenance.
The NetQ Platform
After the collected data is sent to and stored in the NetQ database, you can:
- Validate configurations and identify misconfigurations in your current network or in a previous deployment.
- Monitor communication paths throughout the network.
- Notify users of network issues.
- Anticipate the impact of connectivity changes.
Validate Configurations
You can monitor and validate your network’s health in the UI or through two sets of commands: netq check and netq show. They extract the information from the network service component and event service. The network service component is continually validating the connectivity and configuration of the devices and protocols running on the network. Using the netq check and netq show commands displays the status of the various components and services on a networkwide and complete software stack basis. See the command line reference for an exhaustive list of netq check and netq show commands.
Monitor Communication Paths
The trace engine validates the available communication paths between two network devices. The corresponding netq trace command enables you to view all of the paths between the two devices and if there are any breaks in the paths. For more information about trace requests, refer to Verify Network Connectivity.
View Historical State and Configuration Info
You can run all check, show, and trace commands for current and past statuses. To investigate past issues, use the netq check command and look for configuration or operational issues around the time that NetQ timestamped event messages. Then use the netq show commands to view information about device configurations. You can also use the netq trace command to see what the connectivity looked like between any problematic nodes at a particular time.
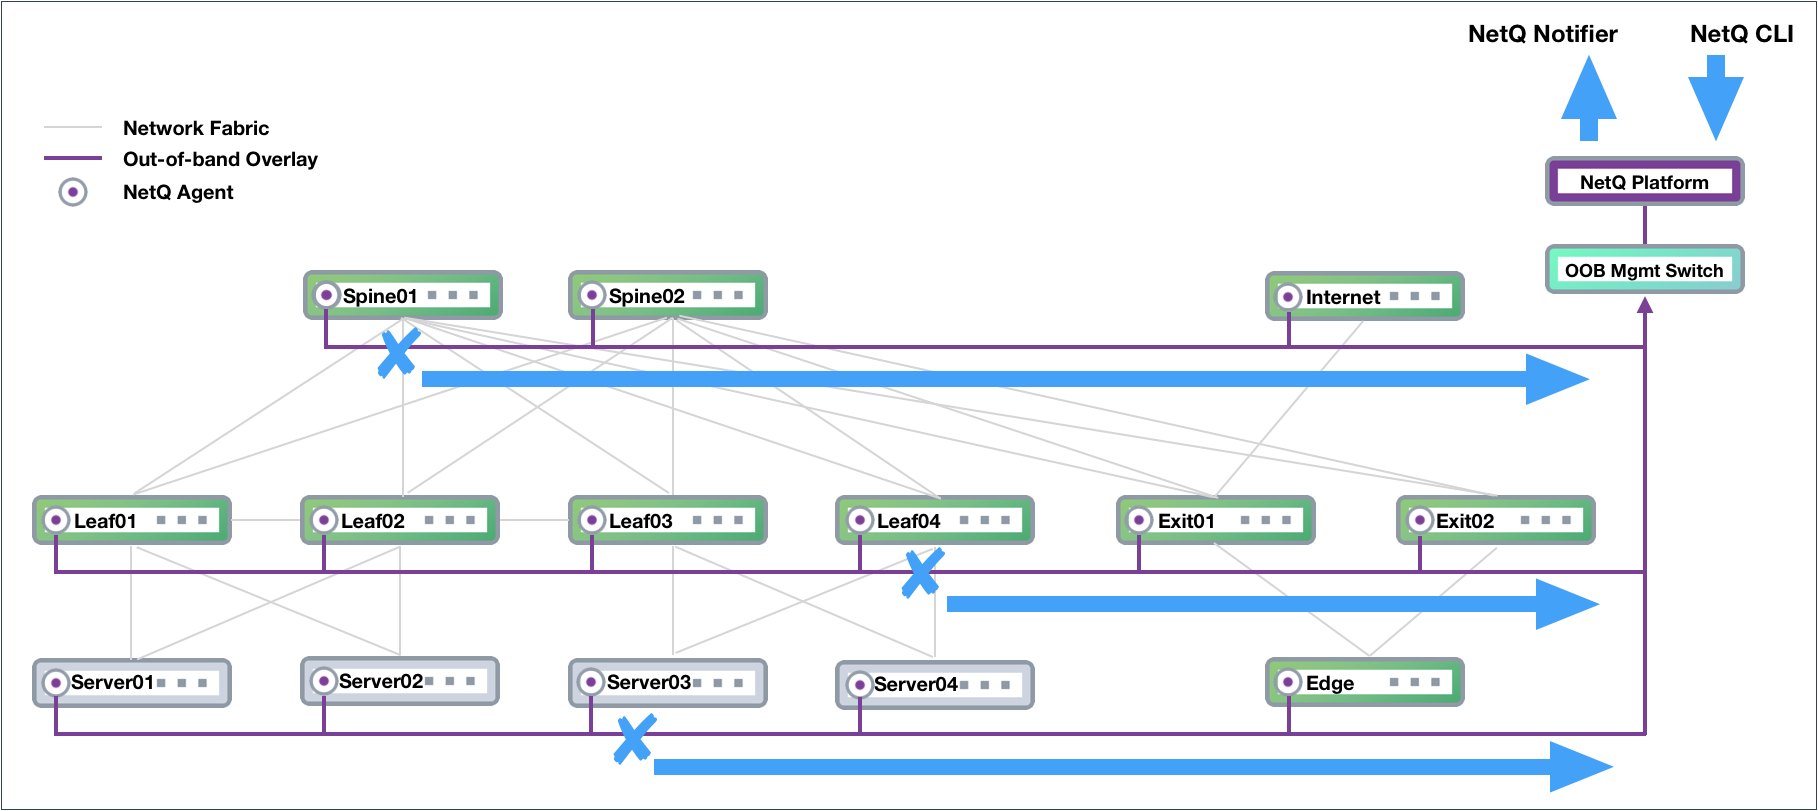
For example, the following diagram shows issues on spine01, leaf04, and server03:

An administrator can run the following commands from any switch in the network to determine the cause of a BGP error on spine01:
cumulus@switch:~$ netq check bgp around 30m
Total Nodes: 25, Failed Nodes: 3, Total Sessions: 220 , Failed Sessions: 24,
Hostname          VRF             Peer Name         Peer Hostname     Reason                                        Last Changed
----------------- --------------- ----------------- ----------------- --------------------------------------------- -------------------------
exit-1            DataVrf1080     swp6.2            firewall-1        BGP session with peer firewall-1 swp6.2: AFI/ 1d:2h:6m:21s
                                                                      SAFI evpn not activated on peer
exit-1            DataVrf1080     swp7.2            firewall-2        BGP session with peer firewall-2 (swp7.2 vrf  1d:1h:59m:43s
                                                                      DataVrf1080) failed,
                                                                      reason: Peer not configured
exit-1            DataVrf1081     swp6.3            firewall-1        BGP session with peer firewall-1 swp6.3: AFI/ 1d:2h:6m:21s
                                                                      SAFI evpn not activated on peer
exit-1            DataVrf1081     swp7.3            firewall-2        BGP session with peer firewall-2 (swp7.3 vrf  1d:1h:59m:43s
                                                                      DataVrf1081) failed,
                                                                      reason: Peer not configured
exit-1            DataVrf1082     swp6.4            firewall-1        BGP session with peer firewall-1 swp6.4: AFI/ 1d:2h:6m:21s
                                                                      SAFI evpn not activated on peer
exit-1            DataVrf1082     swp7.4            firewall-2        BGP session with peer firewall-2 (swp7.4 vrf  1d:1h:59m:43s
                                                                      DataVrf1082) failed,
                                                                      reason: Peer not configured
exit-1            default         swp6              firewall-1        BGP session with peer firewall-1 swp6: AFI/SA 1d:2h:6m:21s
                                                                      FI evpn not activated on peer
exit-1            default         swp7              firewall-2        BGP session with peer firewall-2 (swp7 vrf de 1d:1h:59m:43s
...

cumulus@switch:~$ netq exit-1 show bgp
Matching bgp records:
Hostname          Neighbor                     VRF             ASN        Peer ASN   PfxRx        Last Changed
----------------- ---------------------------- --------------- ---------- ---------- ------------ -------------------------
exit-1            swp3(spine-1)                default         655537     655435     27/24/412    Fri Feb 15 17:20:00 2019
exit-1            swp3.2(spine-1)              DataVrf1080     655537     655435     14/12/0      Fri Feb 15 17:20:00 2019
exit-1            swp3.3(spine-1)              DataVrf1081     655537     655435     14/12/0      Fri Feb 15 17:20:00 2019
exit-1            swp3.4(spine-1)              DataVrf1082     655537     655435     14/12/0      Fri Feb 15 17:20:00 2019
exit-1            swp4(spine-2)                default         655537     655435     27/24/412    Fri Feb 15 17:20:00 2019
exit-1            swp4.2(spine-2)              DataVrf1080     655537     655435     14/12/0      Fri Feb 15 17:20:00 2019
exit-1            swp4.3(spine-2)              DataVrf1081     655537     655435     14/12/0      Fri Feb 15 17:20:00 2019
exit-1            swp4.4(spine-2)              DataVrf1082     655537     655435     13/12/0      Fri Feb 15 17:20:00 2019
exit-1            swp5(spine-3)                default         655537     655435     28/24/412    Fri Feb 15 17:20:00 2019
exit-1            swp5.2(spine-3)              DataVrf1080     655537     655435     14/12/0      Fri Feb 15 17:20:00 2019
exit-1            swp5.3(spine-3)              DataVrf1081     655537     655435     14/12/0      Fri Feb 15 17:20:00 2019
exit-1            swp5.4(spine-3)              DataVrf1082     655537     655435     14/12/0      Fri Feb 15 17:20:00 2019
exit-1            swp6(firewall-1)             default         655537     655539     73/69/-      Fri Feb 15 17:22:10 2019
exit-1            swp6.2(firewall-1)           DataVrf1080     655537     655539     73/69/-      Fri Feb 15 17:22:10 2019
exit-1            swp6.3(firewall-1)           DataVrf1081     655537     655539     73/69/-      Fri Feb 15 17:22:10 2019
exit-1            swp6.4(firewall-1)           DataVrf1082     655537     655539     73/69/-      Fri Feb 15 17:22:10 2019
exit-1            swp7                         default         655537     -          NotEstd      Fri Feb 15 17:28:48 2019
exit-1            swp7.2                       DataVrf1080     655537     -          NotEstd      Fri Feb 15 17:28:48 2019
exit-1            swp7.3                       DataVrf1081     655537     -          NotEstd      Fri Feb 15 17:28:48 2019
exit-1            swp7.4                       DataVrf1082     655537     -          NotEstd      Fri Feb 15 17:28:48 2019
Manage Network Events
The NetQ notifier lets you capture and filter events for devices, components, protocols, and services. This is especially useful when an interface or routing protocol goes down and you want to get them back up and running as quickly as possible. You can improve resolution time significantly by creating filters that focus on topics appropriate for a particular group of users. You can create filters for events related to BGP and MLAG session states, interfaces, links, NTP and other services, fans, power supplies, and physical sensor measurements.
The following is an example of a Slack message received on a netq-notifier channel indicating that the BGP session on switch leaf04 interface swp2 has gone down:

For more information, refer to Events and Notifications.
Timestamps in NetQ
Every event or entry in the NetQ database is stored with a timestamp that reports when the NetQ Agent captured an event on the switch or server. This timestamp is based on the switch or server time where the NetQ Agent is running, and is pushed in UTC format.
Interface state, IP addresses, routes, ARP/ND table (IP neighbor) entries and MAC table entries carry a timestamp that represents the time an event occurred (such as when a route is deleted or an interface comes up).
Data that is captured and saved based on polling has a timestamp according to when the information was captured rather than when the event actually happened, though NetQ compensates for this if the data extracted provides additional information to compute a more precise time of the event. For example, BGP uptime can be used to determine when the event actually happened in conjunction with the timestamp.
Restarting a NetQ Agent on a device does not update the timestamps for existing objects to reflect this new restart time. NetQ preserves their timestamps relative to the original start time of the Agent. A rare exception is if you reboot the device between the time it takes the Agent to stop and restart; in this case, the time is still relative to the start time of the Agent.
Exporting NetQ Data
You can export data from the NetQ Platform in the CLI or UI:
- In the CLI, use the
jsonoption to output command results to JSON format for parsing in other applications - In the UI, expand the cards to a full-screen, tabular view and select
Export.
Important File Locations
The following configuration and log files can help with troubleshooting. See Troubleshoot NetQ for more information.
| File | Description |
|---|---|
/etc/netq/netq.yml |
The NetQ configuration file. This file appears only if you installed either the netq-apps package or the NetQ Agent on the system. |
/var/log/netqd.log |
The NetQ daemon log file for the NetQ CLI. This log file appears only if you installed the netq-apps package on the system. |
/var/log/netq-agent.log |
The NetQ Agent log file. This log file appears only if you installed the NetQ Agent on the system. |