BGP
Use the UI or CLI to monitor Border Gateway Protocol (BGP) on a networkwide or per-session basis.
BGP Commands
- netq show bgp
- netq check bgp
- netq show events message_type bgp
- netq show events-config message_type bgp
View BGP in the UI
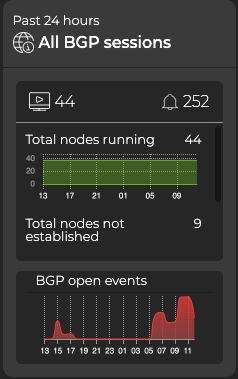
To add the BGP card to your workbench, navigate to the header and select ![]() Add card > Other card > Network services > All BGP Sessions card > Open cards. In this example, there are 44 nodes running the BGP protocol, 252 open events (from the last 24 hours), and 9 nodes with unestablished sessions.
Add card > Other card > Network services > All BGP Sessions card > Open cards. In this example, there are 44 nodes running the BGP protocol, 252 open events (from the last 24 hours), and 9 nodes with unestablished sessions.
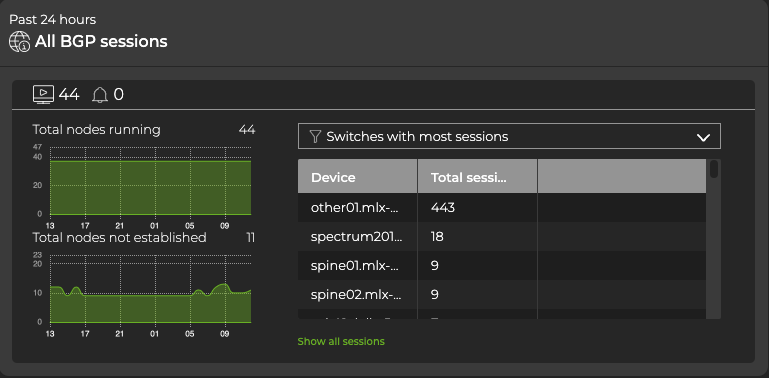
Expand to the large card for additional BGP info. By default, the card displays the Sessions summary tab. From here you can see which devices are handling the most BGP sessions, or select the dropdown to view nodes with the most unestablished BGP sessions. You can view BGP-related events by selecting the ![]() Events tab.
Events tab.
Expand the BGP card to full-screen to view, filter, or export:
- Virtual routing and forwarding (VRF) information
- Autonomous system number (ASN) assignments
- Peer ASNs
- The received address prefix for IPv4/IPv6/EVPN when the session is established
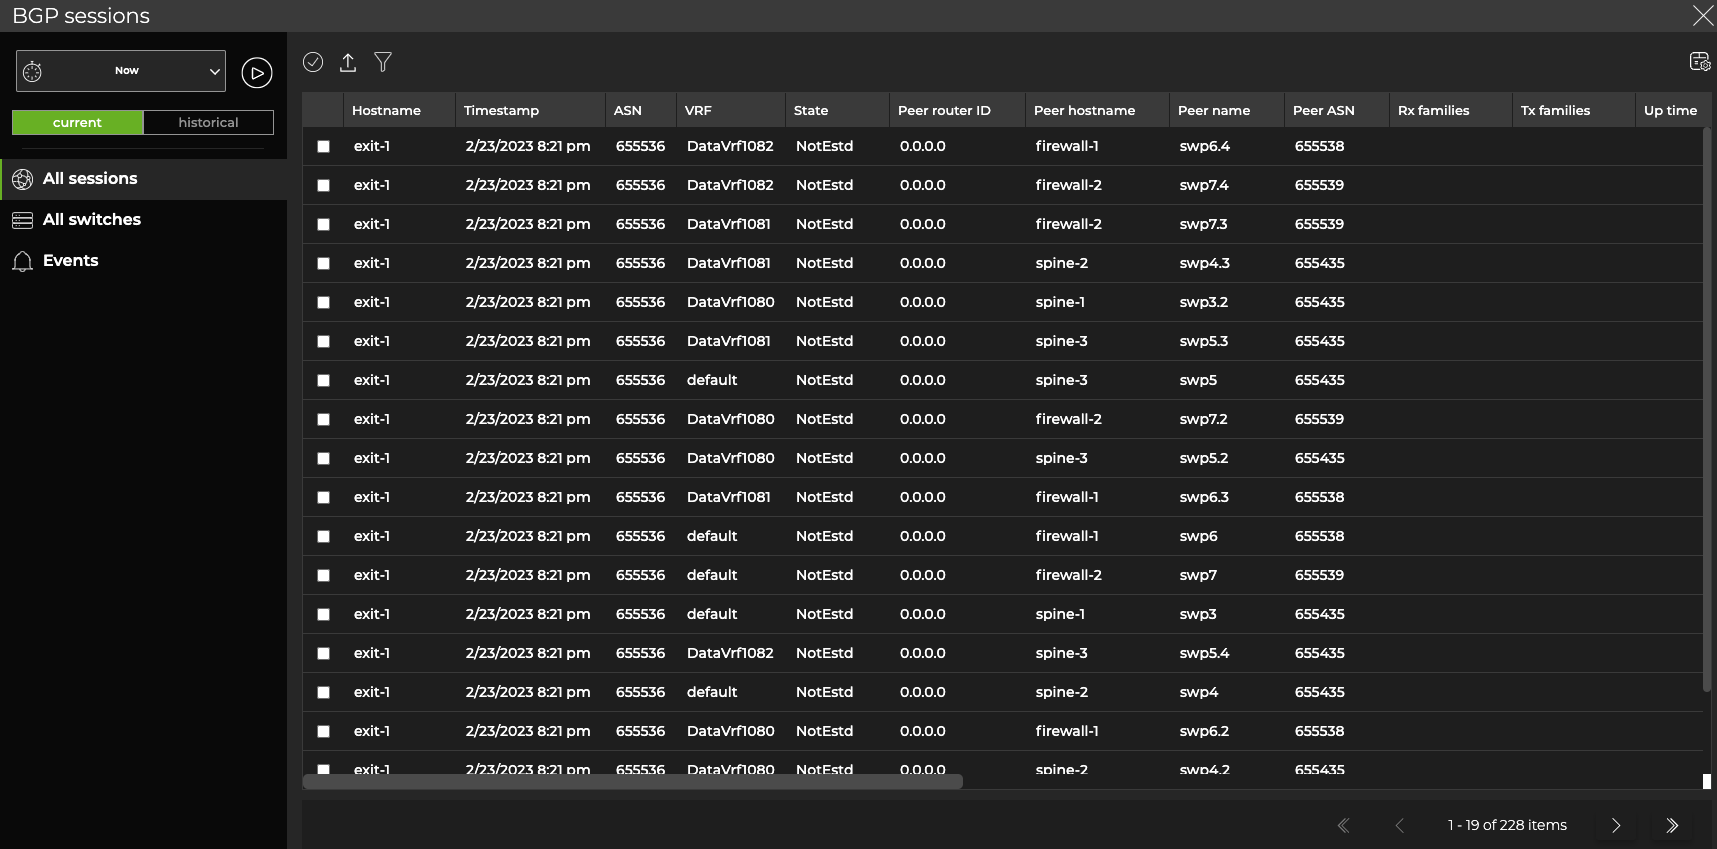
From this table, you can select a row, then click ![]() Open card above the table.
Open card above the table.
NetQ adds a new, BGP ‘single-session’ card to your workbench. From this card, you can view session state changes and compare them with events, and monitor the running BGP configuration and changes to the configuration file.
Before adding a BGP single-session card, verify that both the peer hostname and peer ASN are valid. This ensures the information presented is reliable.
Monitor a Single BGP Session
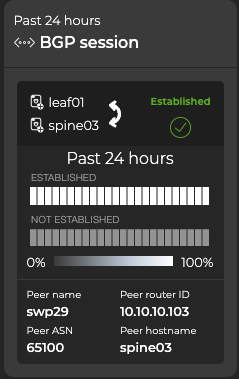
The BGP single-session card displays the node, its peer, its status (established or unestablished), and its router ID. This information can help you determine the stability of the BGP session between two devices. The heat map indicates the status of the session over the designated time period. In this example, the session has been established throughout the entire time period:
Understanding the Heat Map
On the medium and large single-session cards, vertically stacked heat maps represent the status of the sessions: one for established sessions, and one for unestablished sessions. Depending on the time period of data on the card, the number of smaller time blocks indicate that the status varies. A vertical stack of time blocks, one from each map, includes the results from all checks during that time. The results appear by how saturated the color is for each block. If only established sessions occurred during that time period for the entire time block, then the top block is 100% saturated (white) and the unestablished block is 0% saturated (gray). As unestablished sessions increase in saturation, the established sessions block is proportionally reduced in saturation. The following table lists the most common time periods, their corresponding number of blocks, and the amount of time represented by one block:
| Time Period | Number of Runs | Number Time Blocks | Amount of Time in Each Block |
|---|---|---|---|
| 6 hours | 18 | 6 | 1 hour |
| 12 hours | 36 | 12 | 1 hour |
| 24 hours | 72 | 24 | 1 hour |
| 1 week | 504 | 7 | 1 day |
| 1 month | 2,086 | 30 | 1 day |
| 1 quarter | 7,000 | 13 | 1 week |