Validate Overall Network Health
The Network Health card in the NetQ UI lets you view the overall health of your network at a glance, giving you a high-level understanding of how well your network is operating. Overall network health shown in this card is based on successful validation results.
View Network Health Summary
You can view a very simple summary of your network health, including the percentage of successful validation results, a trend indicator, and a distribution of the validation results.
To view this summary:
-
Open or locate the Network Health card on your workbench.
-
Change to the small card using the card size picker.
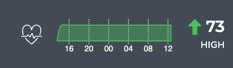
In this example, the overall health is relatively good, but improving compared to recent status. Refer to the next section for viewing the key health metrics.
View Key Metrics of Network Health
Overall network health in the NetQ UI is a calculated average of several key health metrics: System, Network Services, and Interface health.
To view these key metrics:
-
Open or locate the Network Health card on your workbench.
-
Change to the medium card if needed.
Each metric is shown with percentage of successful validations, a trend indicator, and a distribution of the validation results.
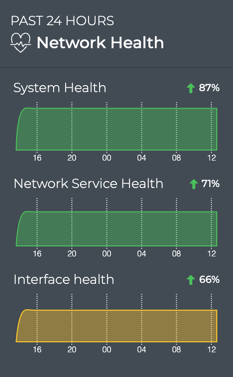
In this example, the health of each of the system and network services are good, but interface health is on the lower side. While it is improving, you might choose to dig further if it does not continue to improve. Refer to the following section for additional details.
View System Health
The system health is a calculated average of the NetQ Agent, Cumulus Linux license, and sensor health metrics. In all cases, validation is performed on the agents and licenses. If you are monitoring platform sensors, the calculation includes these as well.
To view information about each system component:
-
Open or locate the Network Health card on your workbench.
-
Change to the large card using the card size picker.
-
By default, the System Health tab is displayed. If it is not, hover over the card and click
 .
.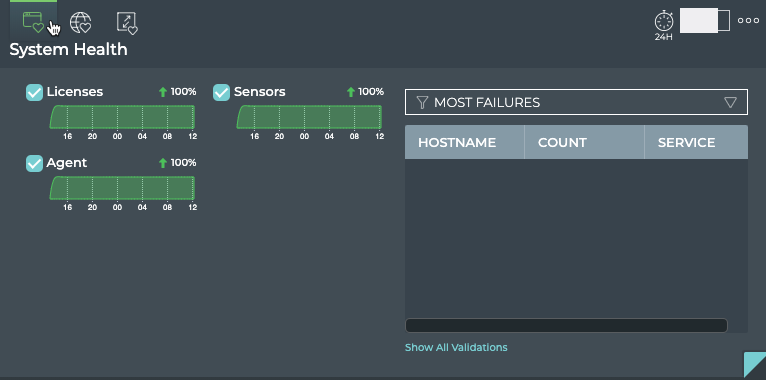
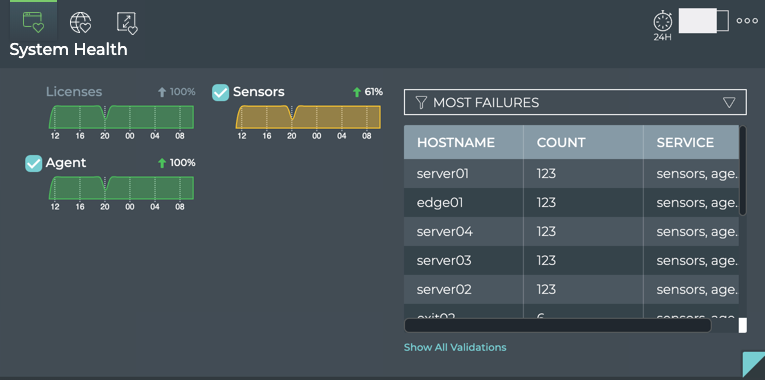
The health of each system protocol or service is represented on the left side of the card by a distribution of the health score, a trend indicator, and a percentage of successful results. The right side of the card provides a listing of devices with failures related to Agents, licenses and sensors.
View Devices with the Most System Issues
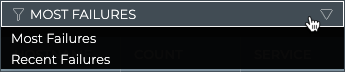
It is useful to know which devices are experiencing the most issues with their system services in general, as this can help focus troubleshooting efforts toward selected devices versus the service itself. To view devices with the most issues, select Most Failures from the filter above the table on the right.
Devices with the highest number of issues are listed at the top. Scroll down to view those with fewer issues. To further investigate the critical devices, open the the Switch card or Events|Alarm and Events|Info cards and filter on the indicated switches.
View Devices with Recent System Issues
It is useful to know which devices are experiencing the most issues with their system services right now, as this can help focus troubleshooting efforts toward devices with current issues. To view devices with recent issues, select Recent Failures from the filter above the table on the right. Devices with the highest number of issues are listed at the top. Scroll down to view those with fewer issues. To further investigate the critical devices, open the Switch card or the Events|Alarms and Events|Info cards and filter on the indicated switches.
Filter Results by System Service
You can focus the data in the table on the right, by unselecting one or more services. Click the checkbox next to the service you want to remove from the data. In this example, we have unchecked Licenses.
This removes the checkbox next to the associated chart and grays out the title of the chart, temporarily removing the data related to that service from the table. Add it back by hovering over the chart and clicking the checkbox that appears.
View Details of a Particular System Service
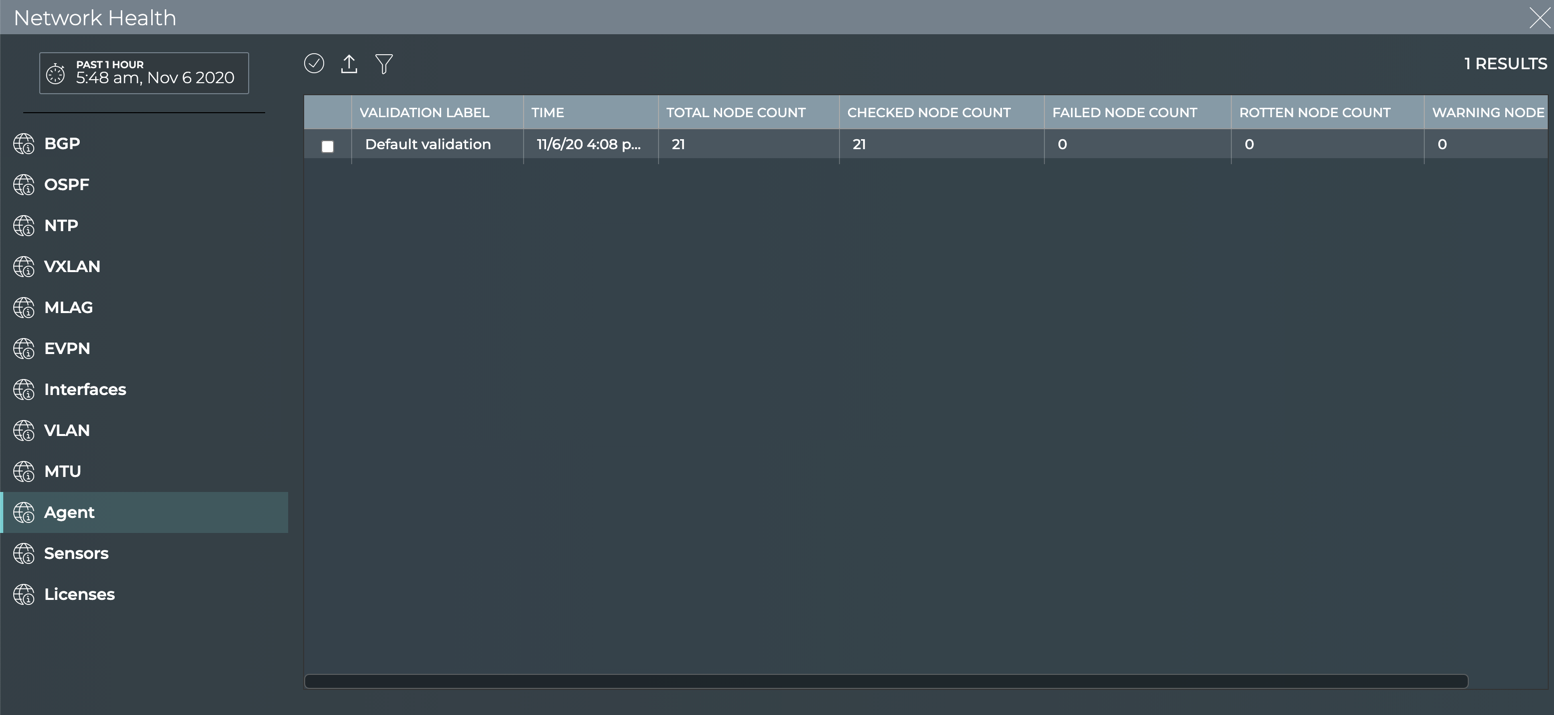
From the System Health tab on the large Network Health card you can click on a chart to take you to the full-screen card pre-focused on that service data.
This example shows the results of clicking on the Agent chart.
View Network Services Health
The network services health is a calculated average of the individual network protocol and services health metrics. In all cases, validation is performed on NTP. If you are running BGP, EVPN, MLAG, OSPF, or VXLAN protocols the calculation includes these as well. You can view the overall health of network services from the medium Network Health card and information about individual services from the Network Service Health tab on the large Network Health card.
To view information about each network protocol or service:
-
Open or locate the Network Health card on your workbench.
-
Change to the large card using the card size picker.
-
Hover over the card and click
 .
.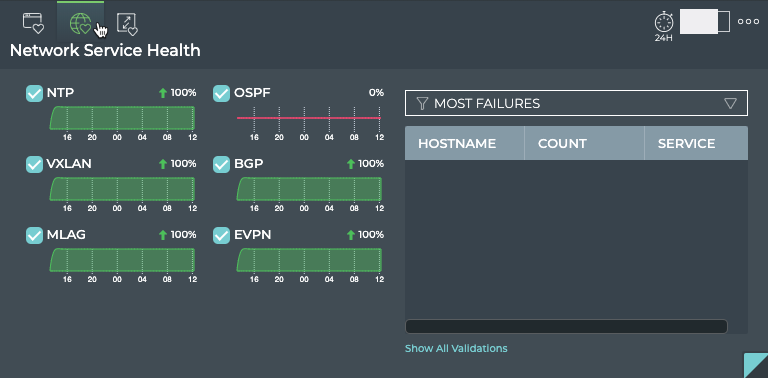
The health of each network protocol or service is represented on the left side of the card by a distribution of the health score, a trend indicator, and a percentage of successful results. The right side of the card provides a listing of devices with failures related to these protocols and services.
View Devices with the Most Network Service Issues
It is useful to know which devices are experiencing the most issues with their network services in general, as this can help focus troubleshooting efforts toward selected devices versus the protocol or service. To view devices with the most issues, select Most Failures from the filter above the table on the right.
Devices with the highest number of issues are listed at the top. Scroll down to view those with fewer issues. To further investigate the critical devices, open the Switch card or Events|Alarms and Events|Info cards and filter on the indicated switches.
View Devices with Recent Network Service Issues
It is useful to know which devices are experiencing the most issues with their network services right now, as this can help focus troubleshooting efforts toward devices with current issues.
To view devices with the most issues, open the large Network Health card. Select Recent Failures from the dropdown above the table on the right. Devices with the highest number of issues are listed at the top. Scroll down to view those with fewer issues. To further investigate the critical devices, open the Switch card or the Events|Alarms and Events|Info cards and filter on the indicated switches.
Filter Results by Network Service
You can focus the data in the table on the right, by unselecting one or more services. Click the checkbox next to the service you want to remove. In this example, we removed NTP and are in the process of removing OSPF.
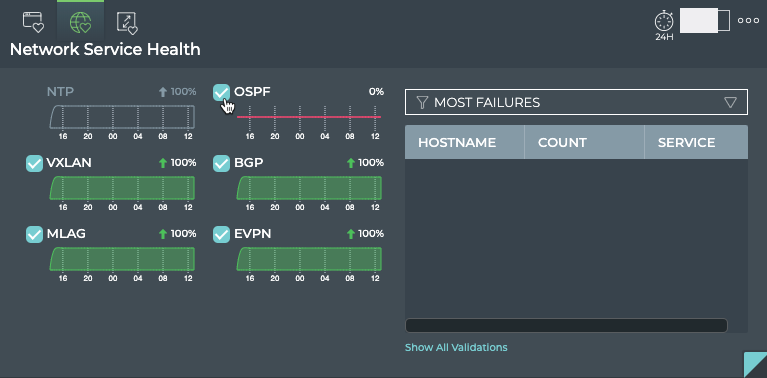
This grays out the chart title and removes the associated checkbox, temporarily removing the data related to that service from the table.
View Details of a Particular Network Service
From the Network Service Health tab on the large Network Health card you can click on a chart to take you to the full-screen card pre-focused on that service data.
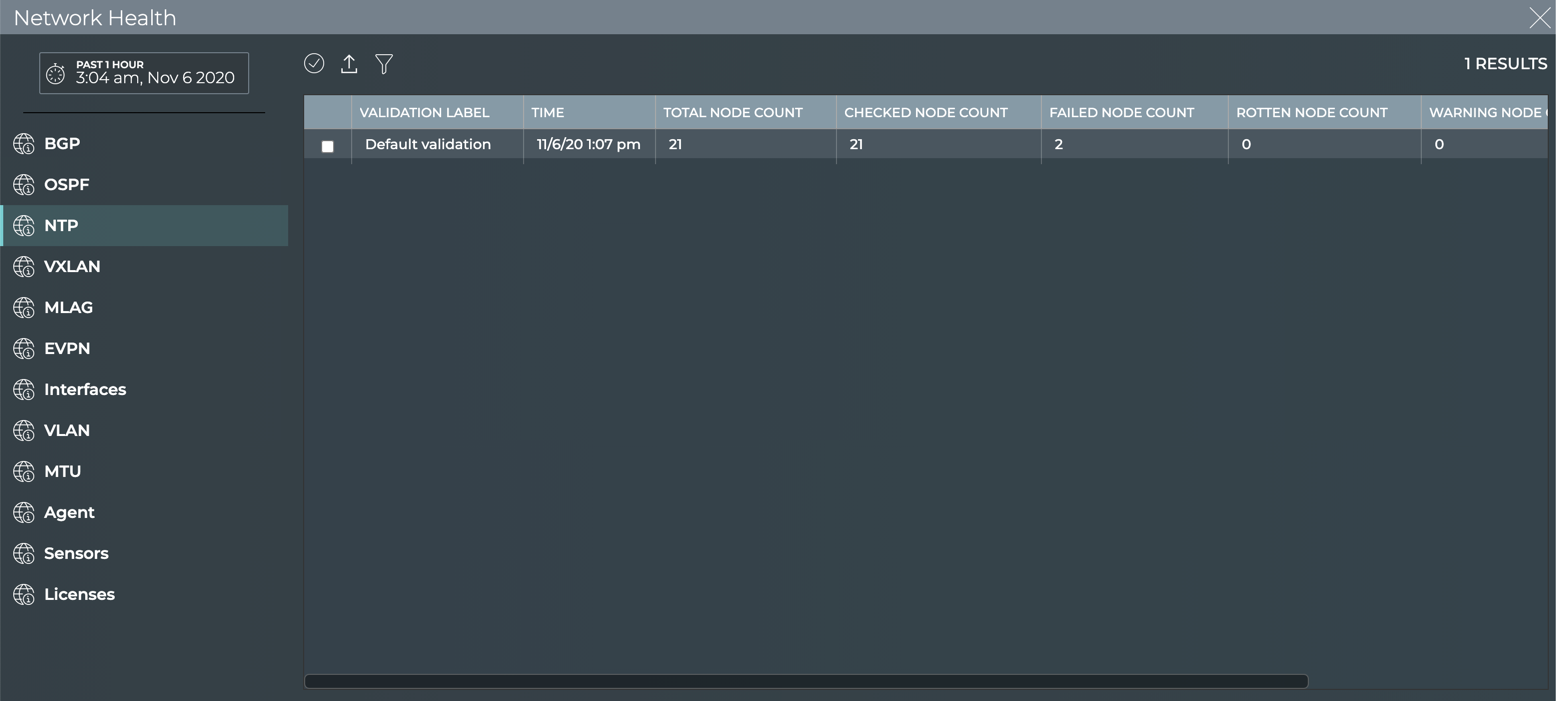
This example shows the results of clicking on the NTP chart.
View Interfaces Health
The interface health is a calculated average of the interfaces, VLAN, and link MTU health metrics. You can view the overall health of interfaces from the medium Interface Health card and information about each component from the Interface Health tab on the large Interface Health card.
To view information about each system component:
-
Open or locate the Network Health card on your workbench.
-
Change to the large card using the card size picker.
-
Hover over the card and click
 .
.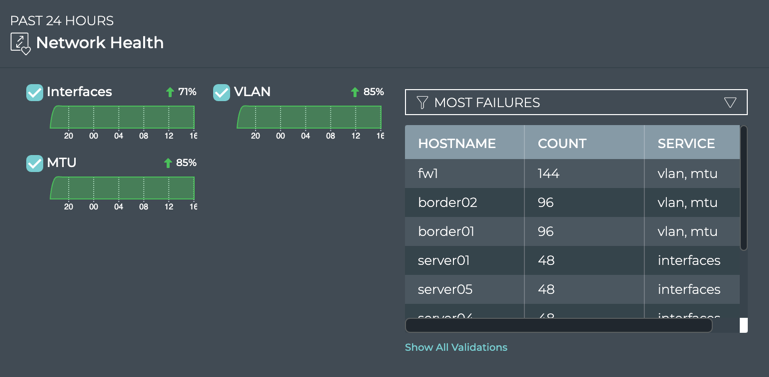
The health of each interface protocol or service is represented on the left side of the card by a distribution of the health score, a trend indicator, and a percentage of successful results. The right side of the card provides a listing of devices with failures related to interfaces, VLANs, and link MTUs.
View Devices with the Most Issues
It is useful to know which devices are experiencing the most issues with their interfaces in general, as this can help focus troubleshooting efforts toward selected devices versus the service itself. To view devices with the most issues, select Most Failures from the filter above the table on the right.
Devices with the highest number of issues are listed at the top. Scroll down to view those with fewer issues. To further investigate the critical devices, open the Switch card or the Events|Alarms and Events|Info cards and filter on the indicated switches.
View Devices with Recent Issues
It is useful to know which devices are experiencing the most issues with their network services right now, as this can help focus troubleshooting efforts toward devices current issues.
To view devices with recent issues, select Recent Failures from the filter above the table on the right. Devices with the highest number of issues are listed at the top. Scroll down to view those with fewer issues. To further investigate the critical devices, open the Switch card or the Event cards and filter on the indicated switches.
Filter Results by Interface Service
You can focus the data in the table on the right, by unselecting one or more services. Click the checkbox next to the interface item you want to remove from the data. In this example, we have unchecked MTU.
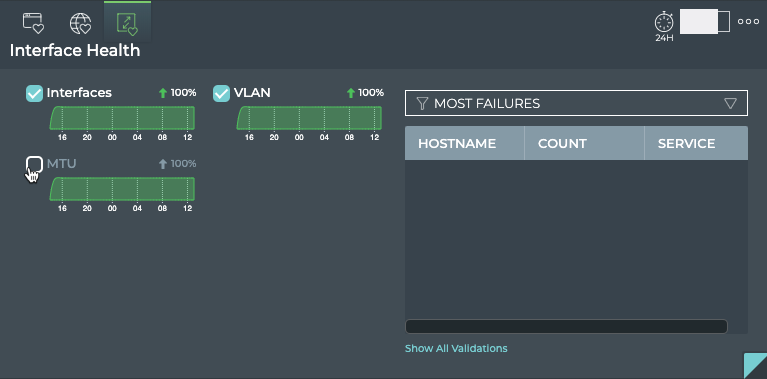
This removes the checkbox next to the associated chart and grays out the title of the chart, temporarily removing the data related to that service from the table. Add it back by hovering over the chart and clicking the checkbox that appears.
View Details of a Particular Interface Service
From the Interface Health tab on the large Network Health card you can click on a chart to take you to the full-screen card pre-focused on that service data.
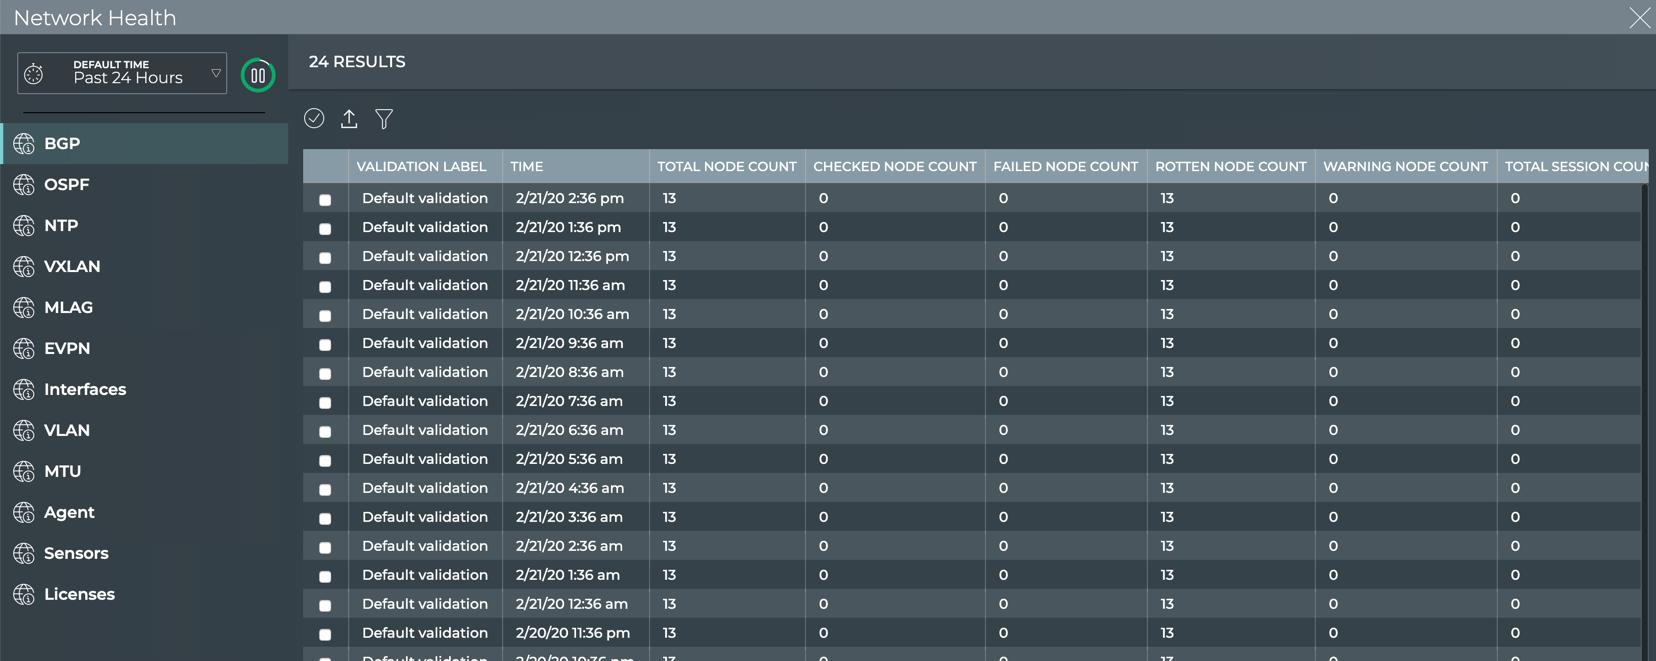
View All Network Protocol and Service Validation Results
The Network Health card workflow enables you to view all of the results of all validations run on the network protocols and services during the designated time period.
To view all the validation results:
-
Open or locate the Network Health card on your workbench.
-
Change to the large card using the card size picker.
-
Click <network protocol or service name> tab in the navigation panel.
-
Look for patterns in the data. For example, when did nodes, sessions, links, ports, or devices start failing validation? Was it at a specific time? Was it when you starting running the service on more nodes? Did sessions fail, but nodes were fine?
Where to go next depends on what data you see, but a few options include:
- Look for matching event information for the failure points in a given protocol or service.
- When you find failures in one protocol, compare with higher level protocols to see if they fail at a similar time (or vice versa with supporting services).
- Export the data for use in another analytics tool, by clicking
 and providing a name for the data file.