If you are using the current version of Cumulus NetQ, the content on this page may not be up to date. The current version of the documentation is available here. If you are redirected to the main page of the user guide, then this page may have been renamed; please search for it there.

Configure and Monitor What Just Happened Metrics

The What Just Happened (WJH) feature, available on Mellanox switches, streams detailed and contextual telemetry data for analysis. This provides real-time visibility into problems in the network, such as hardware packet drops due to buffer congestion, incorrect routing, and ACL or layer 1 problems. You must have Cumulus Linux 4.0.0 or later and NetQ 2.4.0 or later to take advantage of this feature.

If your switches are sourced from a vendor other than Mellanox, this view is blank as no data is collected.

When WJH capabilities are combined with Cumulus NetQ, you have the ability to hone in on losses, anywhere in the fabric, from a single management console. You can:

  • View any current or historic drop information, including the reason for the drop
  • Identify problematic flows or endpoints, and pin-point exactly where communication is failing in the network

By default, Cumulus Linux 4.0.0 provides the NetQ 2.3.1 Agent and CLI. If you installed Cumulus Linux 4.0.0 on your Mellanox switch, you need to upgrade the NetQ Agent and optionally the CLI to release 2.4.0 or later (preferably the latest release).

cumulus@:~$ sudo apt-get update
cumulus@:~$ sudo apt-get install -y netq-agent
cumulus@:~$ netq config restart agent
cumulus@:~$ sudo apt-get install -y netq-apps
cumulus@:~$ netq config restart cli

Configure the WJH Feature

WJH is enabled by default on Mellanox switches and no configuration is required in Cumulus Linux 4.0.0; however, you must enable the NetQ Agent to collect the data in NetQ 2.4.0 or later.

To enable WJH in NetQ:

  1. Configure the NetQ Agent on the Mellanox switch.

    cumulus@switch:~$ netq config add agent wjh
    
  2. Restart the NetQ Agent to start collecting the WJH data.

    cumulus@switch:~$ netq config restart agent
    

When you are finished viewing the WJH metrics, you might want to stop the NetQ Agent from collecting WJH data to reduce network traffic. Use netq config del agent wjh followed by netq config restart agent to disable the WJH feature on the given switch.

Using wjh_dump.py on a Mellanox platform that is running Cumulus Linux 4.0 and the NetQ 2.4.0 agent causes the NetQ WJH client to stop receiving packet drop call backs. To prevent this issue, run wjh_dump.py on a different system than the one where the NetQ Agent has WJH enabled, or disable wjh_dump.py and restart the NetQ Agent (run netq config restart agent).

Configure Latency and Congestion Thresholds

WJH latency and congestion metrics depend on threshold settings to trigger the events. Packet latency is measured as the time spent inside a single system (switch). Congestion is measured as a percentage of buffer occupancy on the switch. When WJH triggers events when the high and low thresholds are crossed.

To configure these thresholds, run:

netq config add agent wjh-threshold (latency|congestion) <text-tc-list> <text-port-list> <text-th-hi> <text-th-lo>

You can specify multiple traffic classes and multiple ports by separating the classes or ports by a comma (no spaces).

This example creates latency thresholds for Class 3 traffic on port swp1 where the upper threshold is 10 and the lower threshold is 1.

cumulus@switch:~$ netq config add agent wjh-threshold latency 3 swp1 10 1

This example creates congestion thresholds for Class 4 traffic on port swp1 where the upper threshold is 200 and the lower threshold is 10.

cumulus@switch:~$ netq config add agent wjh-threshold congestion 4 swp1 200 10

View What Just Happened Metrics

You can view the WJH metrics from the NetQ UI or the NetQ CLI.

  1. Click (main menu).

  2. Click What Just Happened under the Network column.

    This view displays events based on conditions detected in the data plane. The most recent 1000 events from the last 24 hours are presented for each drop category.

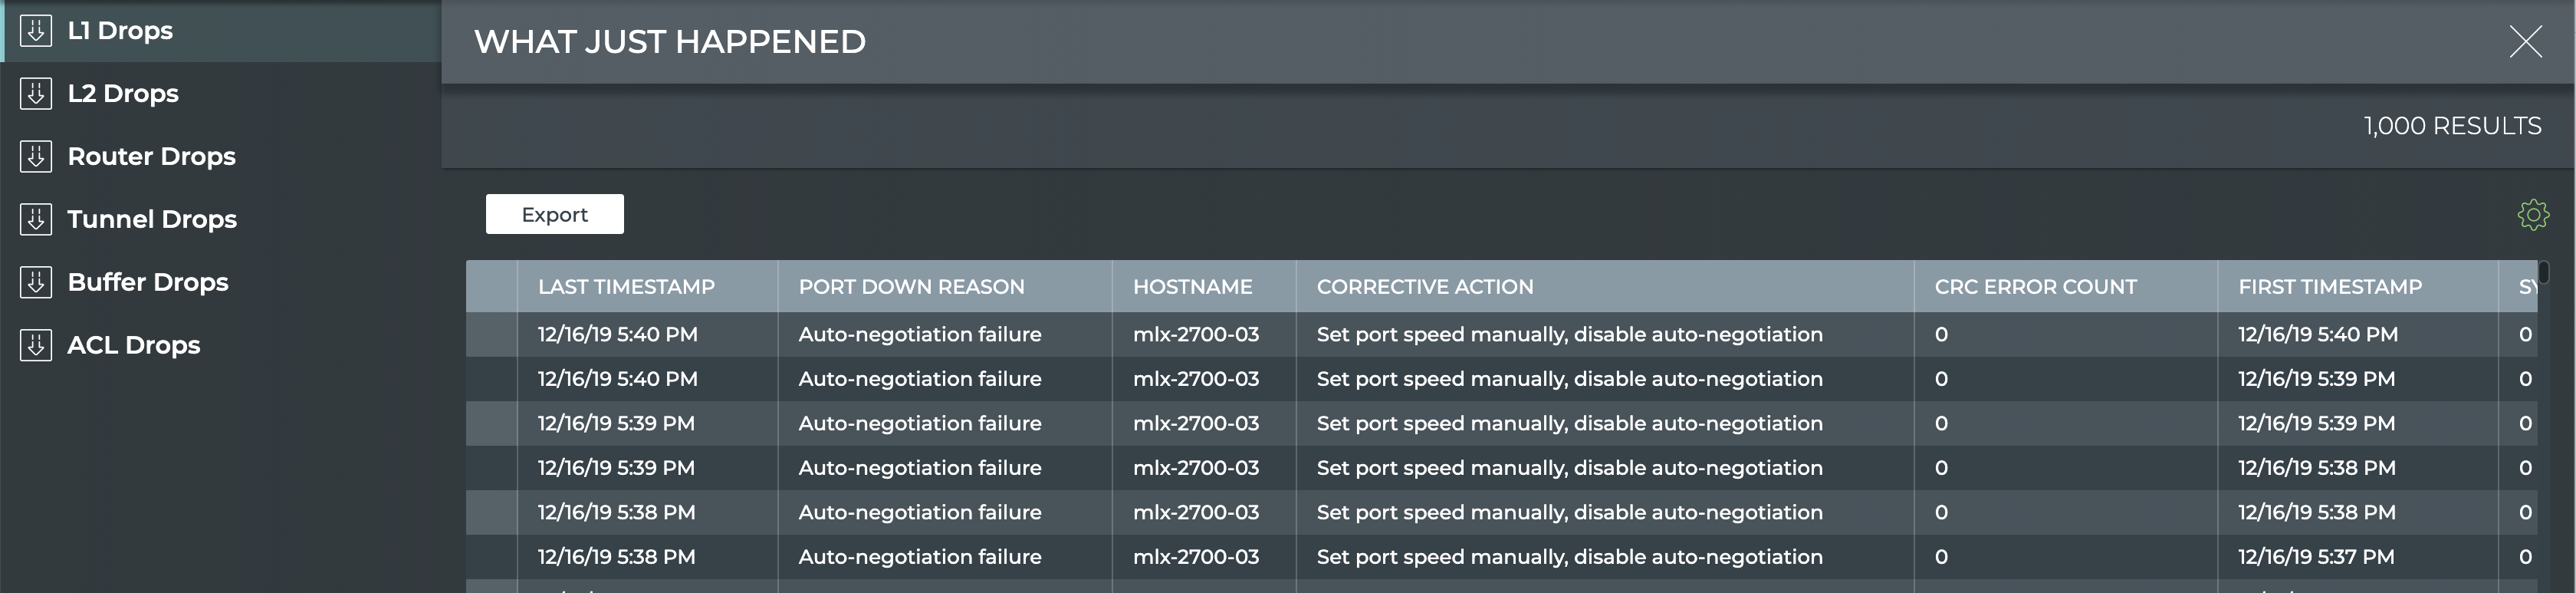
  1. By default the layer 1 drops are shown. Click one of the other drop categories to view those drops for all devices.

Run one of the following commands:

netq [<hostname>] show wjh-drop <text-drop-type> [ingress-port <text-ingress-port>] [severity <text-severity>] [reason <text-reason>] [src-ip <text-src-ip>] [dst-ip <text-dst-ip>] [proto <text-proto>] [src-port <text-src-port>] [dst-port <text-dst-port>] [src-mac <text-src-mac>] [dst-mac <text-dst-mac>] [egress-port <text-egress-port>] [traffic-class <text-traffic-class>] [rule-id-acl <text-rule-id-acl>] [between <text-time> and <text-endtime>] [around <text-time>] [json]
netq [<hostname>] show wjh-drop [ingress-port <text-ingress-port>] [severity <text-severity>] [details] [between <text-time> and <text-endtime>] [around <text-time>] [json]

Use the various options to restrict the output accordingly.

This example uses the first form of the command to show drops on switch leaf03 for the past week.

cumulus@switch:~$ netq leaf03 show wjh-drop between now and 7d
Matching wjh records:
Drop type          Aggregate Count
------------------ ------------------------------
L1                 560
Buffer             224
Router             144
L2                 0
ACL                0
Tunnel             0

This example uses the second form of the command to show drops on switch leaf03 for the past week including the drop reasons.

cumulus@switch:~$ netq leaf03 show wjh-drop details between now and 7d

Matching wjh records:
Drop type          Aggregate Count                Reason
------------------ ------------------------------ ---------------------------------------------
L1                 556                            None
Buffer             196                            WRED
Router             144                            Blackhole route
Buffer             14                             Packet Latency Threshold Crossed
Buffer             14                             Port TC Congestion Threshold
L1                 4                              Oper down

This example shows the drops seen at layer 2 across the network.

cumulus@mlx-2700-03:mgmt:~$ netq show wjh-drop l2
Matching wjh records:
Hostname          Ingress Port             Reason                                        Agg Count          Src Ip           Dst Ip           Proto  Src Port         Dst Port         Src Mac            Dst Mac            First Timestamp                Last Timestamp
----------------- ------------------------ --------------------------------------------- ------------------ ---------------- ---------------- ------ ---------------- ---------------- ------------------ ------------------ ------------------------------ ----------------------------
mlx-2700-03       swp1s2                   Port loopback filter                          10                 27.0.0.19        27.0.0.22        0      0                0                00:02:00:00:00:73  0c:ff:ff:ff:ff:ff  Mon Dec 16 11:54:15 2019       Mon Dec 16 11:54:15 2019
mlx-2700-03       swp1s2                   Source MAC equals destination MAC             10                 27.0.0.19        27.0.0.22        0      0                0                00:02:00:00:00:73  00:02:00:00:00:73  Mon Dec 16 11:53:17 2019       Mon Dec 16 11:53:17 2019
mlx-2700-03       swp1s2                   Source MAC equals destination MAC             10                 0.0.0.0          0.0.0.0          0      0                0                00:02:00:00:00:73  00:02:00:00:00:73  Mon Dec 16 11:40:44 2019       Mon Dec 16 11:40:44 2019

The following two examples include the severity of a drop event (error, warning or notice) for ACLs and routers.

cumulus@switch:~$ netq show wjh-drop acl
Matching wjh records:
Hostname          Ingress Port             Reason                                        Severity         Agg Count          Src Ip           Dst Ip           Proto  Src Port         Dst Port         Src Mac            Dst Mac            Acl Rule Id            Acl Bind Point               Acl Name         Acl Rule         First Timestamp                Last Timestamp
----------------- ------------------------ --------------------------------------------- ---------------- ------------------ ---------------- ---------------- ------ ---------------- ---------------- ------------------ ------------------ ---------------------- ---------------------------- ---------------- ---------------- ------------------------------ ----------------------------
leaf01            swp2                     Ingress router ACL                            Error            49                 55.0.0.1         55.0.0.2         17     8492             21423            00:32:10:45:76:89  00:ab:05:d4:1b:13  0x0                    0                                                              Tue Oct  6 15:29:13 2020       Tue Oct  6 15:29:39 2020
cumulus@switch:~$ netq show wjh-drop router
Matching wjh records:
Hostname          Ingress Port             Reason                                        Severity         Agg Count          Src Ip           Dst Ip           Proto  Src Port         Dst Port         Src Mac            Dst Mac            First Timestamp                Last Timestamp
----------------- ------------------------ --------------------------------------------- ---------------- ------------------ ---------------- ---------------- ------ ---------------- ---------------- ------------------ ------------------ ------------------------------ ----------------------------
leaf01            swp1                     Blackhole route                               Notice           36                 46.0.1.2         47.0.2.3         6      1235             43523            00:01:02:03:04:05  00:06:07:08:09:0a  Tue Oct  6 15:29:13 2020       Tue Oct  6 15:29:47 2020

This table lists all of the supported metrics and provides a brief description of each.

Item Description
Title What Just Happened.
Closes full screen card and returns to workbench.
Results Number of results found for the selected tab.
L1 Drops tab Displays the reason why a port is in the down state. By default, the listing is sorted by Last Timestamp. The tab provides the following additional data about each drop event:
  • Hostname: Name of the Mellanox server.
  • Port Down Reason: Reason why the port is down.
    • Port admin down: Port has been purposely set down by user.
    • Auto-negotiation failure: Negotiation of port speed with peer has failed.
    • Logical mismatch with peer link: Logical mismatch with peer link.
    • Link training failure: Link is not able to go operational up due to link training failure.
    • Peer is sending remote faults: Peer node is not operating correctly.
    • Bad signal integrity: Integrity of the signal on port is not sufficient for good communication.
    • Cable/transceiver is not supported: The attached cable or transceiver is not supported by this port.
    • Cable/transceiver is unplugged: A cable or transceiver is missing or not fully plugged into the port.
    • Calibration failure: Calibration failure.
    • Port state changes counter: Cumulative number of state changes.
    • Symbol error counter: Cumulative number of symbol errors.
    • CRC error counter: Cumulative number of CRC errors.
  • Corrective Action: Provides recommend action(s) to take to resolve the port down state.
  • First Timestamp: Date and time this port was marked as down for the first time.
  • Ingress Port: Port accepting incoming traffic.
  • CRC Error Count: Number of CRC errors generated by this port.
  • Symbol Error Count: Number of Symbol errors generated by this port.
  • State Change Count: Number of state changes that have occurred on this port.
  • OPID: Operation identifier; used for internal purposes.
  • Is Port Up: Indicates whether the port is in an Up (true) or Down (false) state.
L2 Drops tab Displays the reason for a link to be down. By default, the listing is sorted by Last Timestamp. The tab provides the following additional data about each drop event:
  • Hostname: Name of the Mellanox server.
  • Source Port: Port ID where the link originates.
  • Source IP: Port IP address where the link originates.
  • Source MAC: Port MAC address where the link originates.
  • Destination Port: Port ID where the link terminates.
  • Destination IP: Port IP address where the link terminates.
  • Destination MAC: Port MAC address where the link terminates.
  • Reason: Reason why the link is down.
    • MLAG port isolation: Not supported for port isolation implemented with system ACL.
    • Destination MAC is reserved (DMAC=01-80-C2-00-00-0x): The address cannot be used by this link.
    • VLAN tagging mismatch: VLAN tags on the source and destination do not match.
    • Ingress VLAN filtering: Frames whose port is not a member of the VLAN are discarded.
    • Ingress spanning tree filter: Port is in Spanning Tree blocking state.
    • Unicast MAC table action discard: Currently not supported.
    • Multicast egress port list is empty: No ports are defined for multicast egress.
    • Port loopback filter: Port is operating in loopback mode; packets are being sent to itself (source MAC address is the same as the destination MAC address.
    • Source MAC is multicast: Packets have multicast source MAC address.
    • Source MAC equals destination MAC: Source MAC address is the same as the destination MAC address.
  • First Timestamp: Date and time this link was marked as down for the first time.
  • Aggregate Count : Total number of dropped packets.
  • Protocol: ID of the communication protocol running on this link.
  • Ingress Port: Port accepting incoming traffic.
  • OPID: Operation identifier; used for internal purposes.
Router Drops tab Displays the reason why the server is unable to route a packet. By default, the listing is sorted by Last Timestamp. The tab provides the following additional data about each drop event:
  • Hostname: Name of the Mellanox server.
  • Reason: Reason why the server is unable to route a packet.
    • Non-routable packet: Packet has no route in routing table.
    • Blackhole route: Packet received with action equal to discard.
    • Unresolved next-hop: The next hop in the route is unknown.
    • Blackhole ARP/neighbor: Packet received with blackhole adjacency.
    • IPv6 destination in multicast scope FFx0:/16: Packet received with multicast destination address in FFx0:/16 address range.
    • IPv6 destination in multicast scope FFx1:/16: Packet received with multicast destination address in FFx1:/16 address range.
    • Non-IP packet: Cannot read packet header because it is not an IP packet.
    • Unicast destination IP but non-unicast destination MAC: Cannot read packet with IP unicast address when destination MAC address is not unicast (FF:FF:FF:FF:FF:FF).
    • Destination IP is loopback address: Cannot read packet as destination IP address is a loopback address (dip=>127.0.0.0/8).
    • Source IP is multicast: Cannot read packet as source IP address is a multicast address (ipv4 SIP => 224.0.0.0/4).
    • Source IP is in class E: Cannot read packet as source IP address is a Class E address.
    • Source IP is loopback address: Cannot read packet as source IP address is a loopback address ( ipv4 => 127.0.0.0/8 for ipv6 => ::1/128).
    • Source IP is unspecified: Cannot read packet as source IP address is unspecified (ipv4 = 0.0.0.0/32; for ipv6 = ::0).
    • Checksum or IP ver or IPv4 IHL too short: Cannot read packet due to header checksum error, IP version mismatch, or IPv4 header length is too short.
    • Multicast MAC mismatch: For IPv4, destination MAC address is not equal to {0x01-00-5E-0 (25 bits), DIP[22:0]} and DIP is multicast. For IPv6, destination MAC address is not equal to {0x3333, DIP[31:0]} and DIP is multicast.
    • Source IP equals destination IP: Packet has a source IP address equal to the destination IP address.
    • IPv4 source IP is limited broadcast: Packet has broadcast source IP address.
    • IPv4 destination IP is local network (destination = 0.0.0.0/8): Packet has IPv4 destination address that is a local network (destination=0.0.0.0/8).
    • IPv4 destination IP is link local: Packet has IPv4 destination address that is a local link.
    • Ingress router interface is disabled: Packet destined to a different subnet cannot be routed because ingress router interface is disabled.
    • Egress router interface is disabled: Packet destined to a different subnet cannot be routed because egress router interface is disabled.
    • IPv4 routing table (LPM) unicast miss: No route available in routing table for packet.
    • IPv6 routing table (LPM) unicast miss: No route available in routing table for packet.
    • Router interface loopback: Packet has destination IP address that is local. For example, SIP = 1.1.1.1, DIP = 1.1.1.128.
    • Packet size is larger than MTU: Packet has larger MTU configured than the VLAN.
    • TTL value is too small: Packet has TTL value of 1.
Tunnel Drops tab Displays the reason for a tunnel to be down. By default, the listing is sorted by Last Timestamp. The tab provides the following additional data about each drop event:
  • Hostname: Name of the Mellanox server.
  • Reason: Reason why the tunnel is down.
    • Overlay switch - source MAC is multicast: Overlay packet's source MAC address is multicast.
    • Overlay switch - source MAC equals destination MAC: Overlay packet's source MAC address is the same as the destination MAC address.
    • Decapsulation error: Decapsulation produced incorrect format of packet. For example, encapsulation of packet with many VLANs or IP options on the underlay can cause decapsulation to result in a short packet.
Buffer Drops tab Displays the reason for the server buffer to be drop packets. By default, the listing is sorted by Last Timestamp. The tab provides the following additional data about each drop event:
  • Hostname: Name of the Mellanox server.
  • Reason: Reason why the buffer dropped packet.
    • Tail drop: Tail drop is enabled, and buffer queue is filled to maximum capacity.
    • WRED: Weighted Random Early Detection is enabled, and buffer queue is filled to maximum capacity or the RED engine dropped the packet as of random congestion prevention.
    • Port TC Congestion Threshold Crossed: Percentage of the occupancy buffer exceeded or dropped below the specified high or low threshold
    • Packet Latency Threshold Crossed: Time a packet spent within the switch exceeded or dropped below the specified high or low threshold
ACL Drops tab Displays the reason for an ACL to drop packets. By default, the listing is sorted by Last Timestamp. The tab provides the following additional data about each drop event:
  • Hostname: Name of the Mellanox server.
  • Reason: Reason why ACL dropped packets.
    • Ingress port ACL: ACL action set to deny on the physical ingress port or bond.
    • Ingress router ACL: ACL action set to deny on the ingress switch virtual interfaces (SVIs).
    • Egress port ACL: ACL action set to deny on the physical egress port or bond.
    • Egress router ACL: ACL action set to deny on the egress SVIs.
Table Actions Select, export, or filter the list. Refer to Table Settings.