Monitor Network Inventory
With NetQ, a network administrator can monitor both the switch hardware and its operating system for misconfigurations or misbehaving services. The Devices Inventory card workflow provides a view into the switches and hosts installed in your network and their various hardware and software components. The workflow contains a small card with a count of each device type in your network, a medium card displaying the operating systems running on each set of devices, large cards with component information statistics, and full-screen cards displaying tables with attributes of all switches and all hosts in your network.
The Devices Inventory card workflow helps answer questions such as:
- What switches do I have in the network?
- What is the distribution of ASICs across my network?
- Do all switches have valid licenses?
- Are NetQ agents running on all of my switches?
For monitoring inventory and performance on a switch-by-switch basis, refer to Monitor Switches.
Devices Inventory Card Workflow Summary
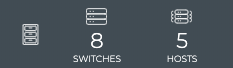
The small Devices Inventory card displays:
| Item | Description |
|---|---|
| Indicates data is for device inventory | |
| Total number of switches in inventory during the designated time period | |
| Total number of hosts in inventory during the designated time period |
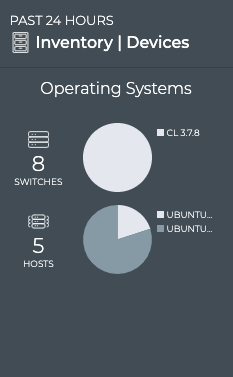
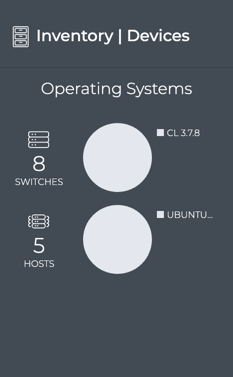
The medium Devices Inventory card displays:
| Item | Description |
|---|---|
| Indicates data is for device inventory | |
| Title | Inventory | Devices |
| Total number of switches in inventory during the designated time period | |
| Total number of hosts in inventory during the designated time period | |
| Charts | Distribution of operating systems deployed on switches and hosts, respectively |
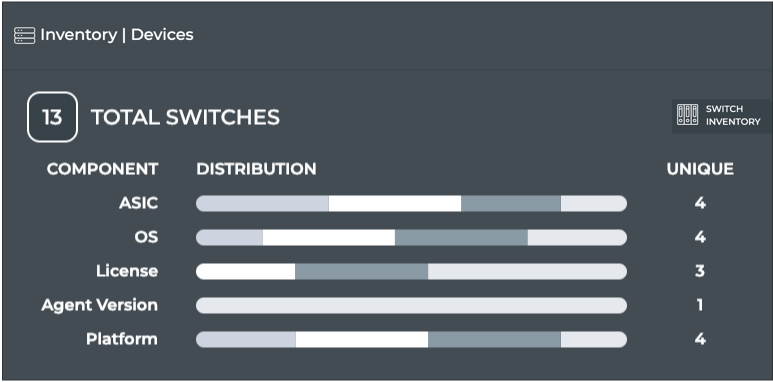
The large Devices Inventory card has one tab.
The Switches tab displays:
| Item | Description |
|---|---|
| Time period | Always Now for inventory by default |
| Indicates data is for device inventory | |
| Title | Inventory | Devices |
| Total number of switches in inventory during the designated time period | |
| Link to full screen listing of all switches | |
| Component | Switch components monitored-ASIC, Operating System (OS), Cumulus Linux license, NetQ Agent version, and Platform |
| Distribution charts | Distribution of switch components across the network |
| Unique | Number of unique items of each component type. For example, for License, you might have CL 2.7.2 and CL 2.7.4, giving you a unique count of two. |
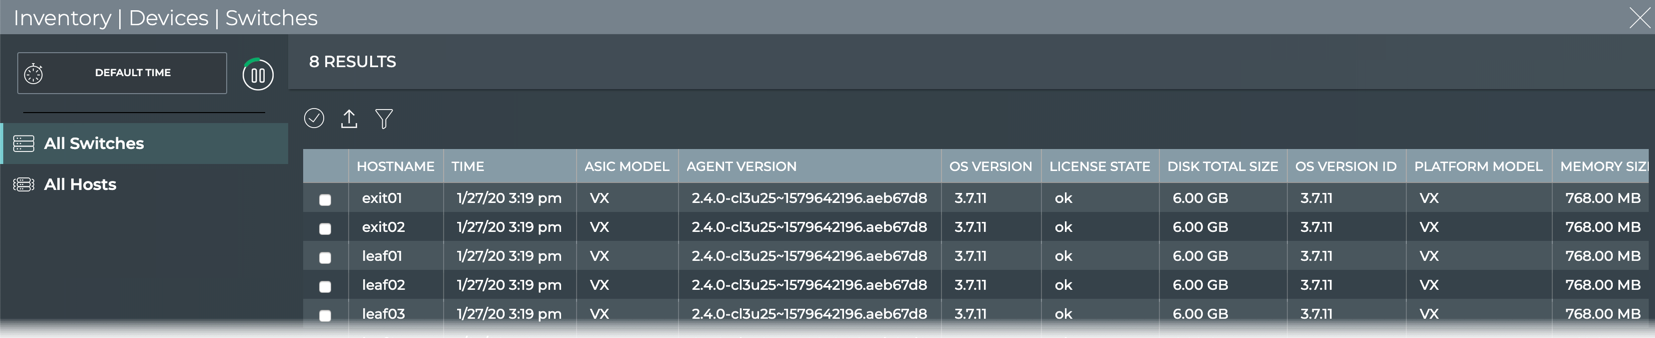
The full screen Devices Inventory card provides tabs for all switches and all hosts.
| Item | Description |
|---|---|
| Title | Inventory | Devices | Switches |
| Closes full screen card and returns to workbench | |
| Time period | Time period does not apply to the Inventory cards. This is always Default Time. | Displays data refresh status. Click |
| Results | Number of results found for the selected tab |
| All Switches and All Hosts tabs | Displays all monitored switches and hosts in your network. By default, the device list is sorted by hostname. These tabs provide the following additional data about each device:
|
View the Number of Each Device Type in Your Network
You can view the number of switches and hosts deployed in your network. As you grow your network this can be useful for validating that devices have been added as scheduled.
To view the quantity of devices in your network, open the small Devices Inventory card.
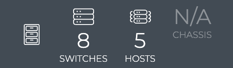
Chassis are not monitored in this release, so an N/A (not applicable) value is displayed for these devices, even if you have chassis in your network.
View Which Operating Systems Are Running on Your Network Devices
You can view the distribution of operating systems running on your switches and hosts. This is useful for verifying which versions of the OS are deployed and for upgrade planning. It also provides a view into the relative dependence on a given OS in your network.
To view the OS distribution, open the medium Devices Inventory card if it is not already on your workbench.
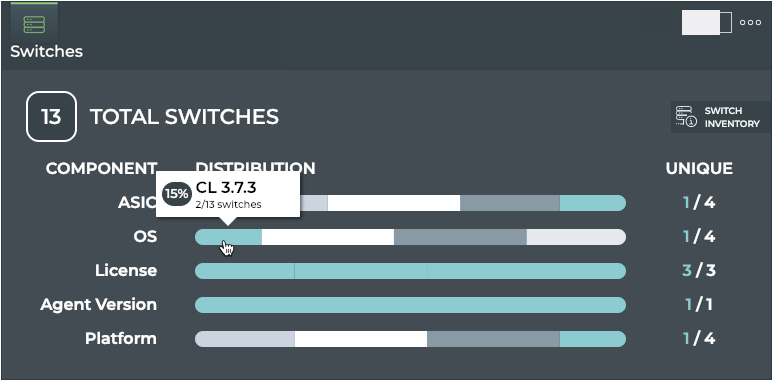
View Switch Components
To view switch components, open the large Devices Inventory card. By default the Switches tab is shown displaying the total number of switches, ASIC vendor, OS versions, license status, NetQ Agent versions, and specific platforms deployed on all of your switches.
Highlight a Selected Component Type
You can hover over any of the segments in a component distribution chart to highlight a specific type of the given component. When you hover, a tooltip appears displaying:
-
the name or value of the component type, such as the version number or status
-
the total number of switches with that type of component deployed compared to the total number of switches
-
percentage of this type with respect to all component types.
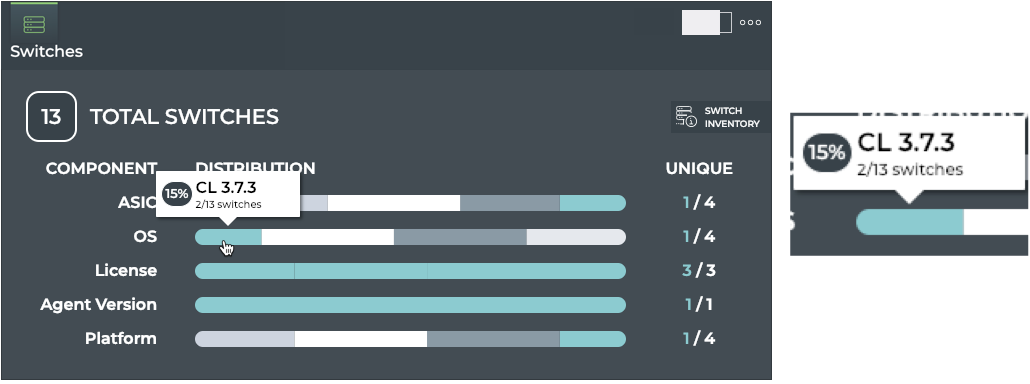
Additionally, sympathetic highlighting is used to show the related component types relevant to the highlighted segment and the number of unique component types associated with this type (shown in blue here).
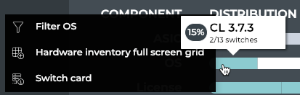
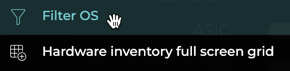
Focus on a Selected Component Type
To dig deeper on a particular component type, you can filter the card data by that type. In this procedure, the result of filtering on the OS is shown.
To view component type data:
-
Click a segment of the component distribution charts.
-
Select the first option from the popup, Filter <component name>. The card data is filtered to show only the components associated with selected component type. A filter tag appears next to the total number of switches indicating the filter criteria.
-
Hover over the segments to view the related components.
-
To return to the full complement of components, click the
 in the filter tag.
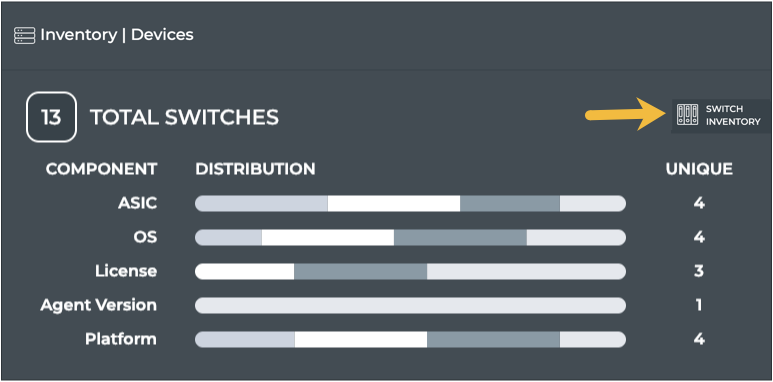
Navigate to the Switch Inventory Workflow
While the Device Inventory cards provide a network-wide view, you may want to see more detail about your switch inventory. This can be found in the Switches Inventory card workflow. To open that workflow, click the Switch Inventory button at the top right of the Switches card.
View All Switches
You can view all stored attributes for all switches in your network. To view all switch details, open the full screen Devices Inventory card and click the All Switches tab in the navigation panel.
To return to your workbench, click ![]() in the top right corner of the card.
in the top right corner of the card.
View All Hosts
You can view all stored attributes for all hosts in your network. To view all hosts details, open the full screen Devices Inventory card and click the All Hosts tab in the navigation panel.
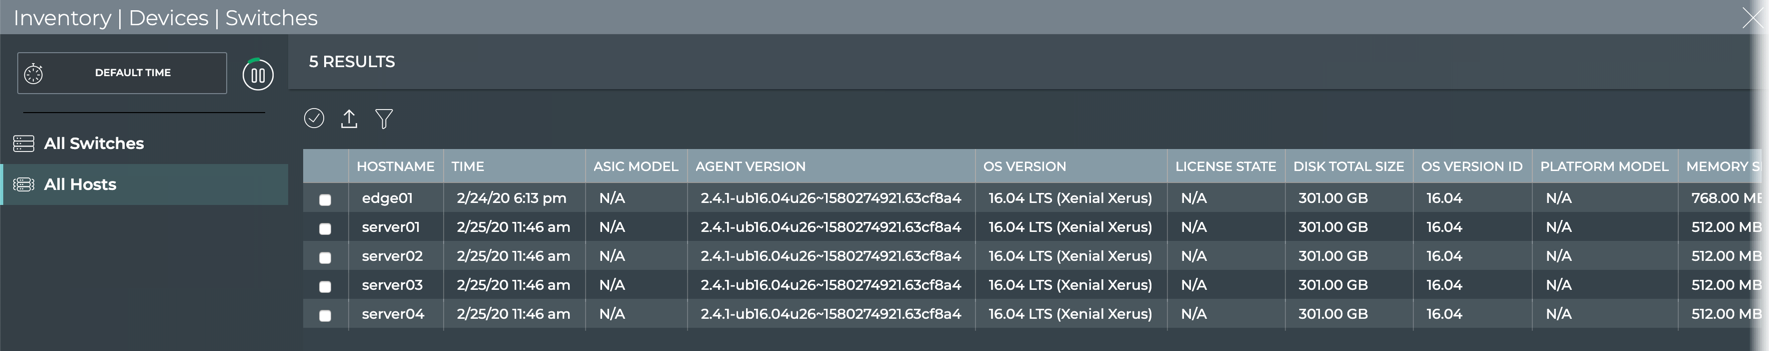
To return to your workbench, click ![]() in the top right corner of the card.
in the top right corner of the card.