Monitor Network Connectivity
It is helpful to verify that communications are freely flowing between the various devices in your network. You can verify the connectivity between two devices in both an adhoc fashion and by defining connectivity checks to occur on a scheduled basis. There are three card workflows which enable you to view connectivity, the Trace Request, On-demand Trace Results, and Scheduled Trace Results.
Create a Trace Request
Two types of connectivity checks can be run-an immediate (on-demand) trace and a scheduled trace. The Trace Request card workflow is used to configure and run both of these trace types.
Trace Request Card Workflow Summary
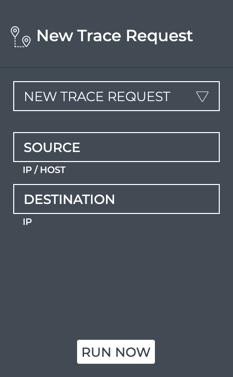
The small Trace Request card displays:

| Item | Description |
|---|---|
| Indicates a trace request | |
| Select Trace list | Select a scheduled trace request from the list |
| Go | Click to start the trace now |
The medium Trace Request card displays:
| Item | Description |
|---|---|
| Indicates a trace request | |
| Title | New Trace Request |
| New Trace Request | Create a new layer 3 trace request. Use the large Trace Request card to create a new layer 2 or 3 request. |
| Source | (Required) Hostname or IP address of device where to begin the trace |
| Destination | (Required) IP address of device where to end the trace |
| Run Now | Start the trace now |
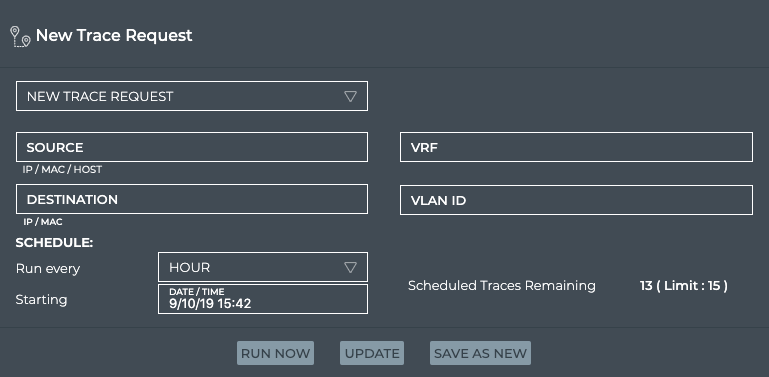
The large Trace Request card displays:
| Item | Description |
|---|---|
| Indicates a trace request | |
| Title | New Trace Request |
| Trace selection | Leave New Trace Request selected to create a new request, or choose a scheduled request from the list. |
| Source | (Required) Hostname, IP address, or MAC address of device where to begin the trace. |
| Destination | (Required) Ending point for the trace. |
| VRF | Optional for layer 3 traces. Virtual Route Forwarding interface to be used as part of the trace path. |
| VLAN ID | Required for layer 2 traces. Virtual LAN to be used as part of the trace path. |
| Schedule | Sets the frequency with which to run a new trace (Run every) and when to start the trace for the first time (Starting). |
| Run Now | Start the trace now |
| Update | Update is available when a scheduled trace request is selected from the dropdown list and you make a change to its configuration. Clicking Update saves the changes to the existing scheduled trace. |
| Save As New | Save As New is available in two instances:
|
The full screen Trace Request card displays:
| Item | Description |
|---|---|
| Title | Trace Request |
| Closes full screen card and returns to workbench | |
| Time period | Range of time in which the displayed data was collected; applies to all card sizes; select an alternate time period by clicking |
| Results | Number of results found for the selected tab |
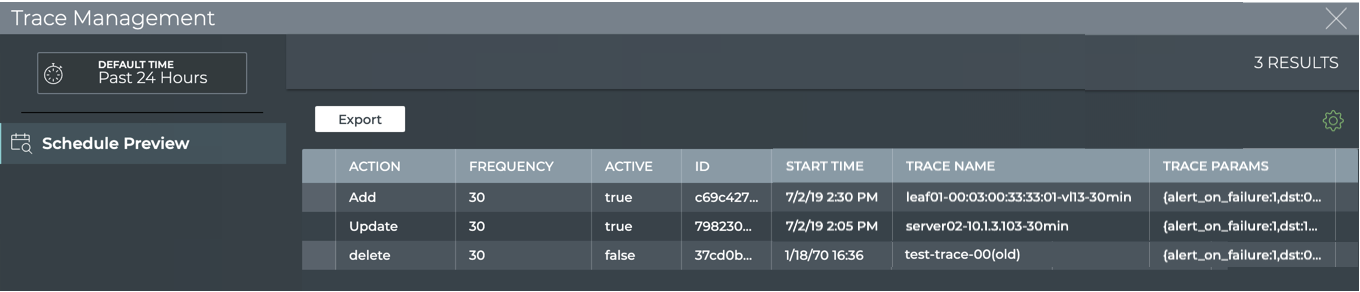
| Schedule Preview tab | Displays all scheduled trace requests for the given user. By default, the listing is sorted by Start Time, with the most recently started traces listed at the top. The tab provides the following additional data about each event:
|
| Table Actions | Select, export, or filter the list. Refer to Table Settings. |
Source and Destination Options
The layer you are performing the trace at and the type of source that you select determines the destination type that can be used. The valid source and destination options are shown in this table.
| Layer | Source | Destination |
|---|---|---|
| 2 | MAC address | MAC address |
| 2, 3 | Hostname | IP address, MAC address |
| 3 | IP address | IP address, MAC address |
Create a Layer 3 On-demand Trace Request
It is helpful to verify the connectivity between two devices when you suspect an issue is preventing proper communication between them. If you cannot find a path through layer 3, you might try checking for connectivity through a layer 2 path.
To create a layer 3 trace request:
-
Open the medium Trace Request card.
-
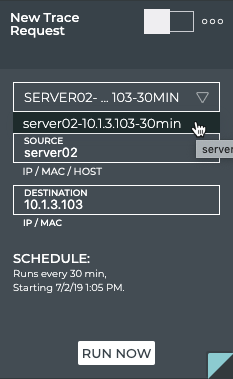
In the Source field, enter the hostname or IP address of the device where you want to start the trace.
-
In the Destination field, enter the IP or MAC address of the device where you want to end the trace.
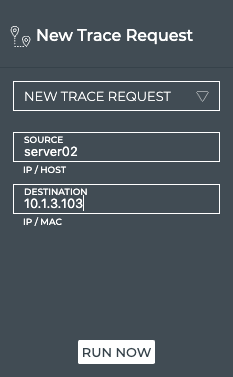
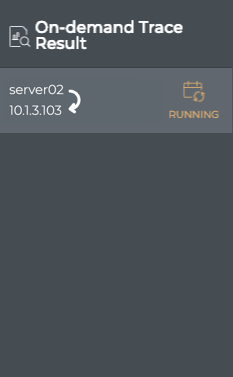
In this example, we are starting our trace at server02 and ending it at 10.1.3.103.
If you mistype an address, you must double-click it, or backspace over the error, and retype the address. You cannot select the address by dragging over it as this action attempts to move the card to another location.
-
Click Run Now. A corresponding Trace Results card is opened on your workbench. Refer to View Layer 3 Trace Results for details.
Create a Layer 3 Trace Through a Given VRF
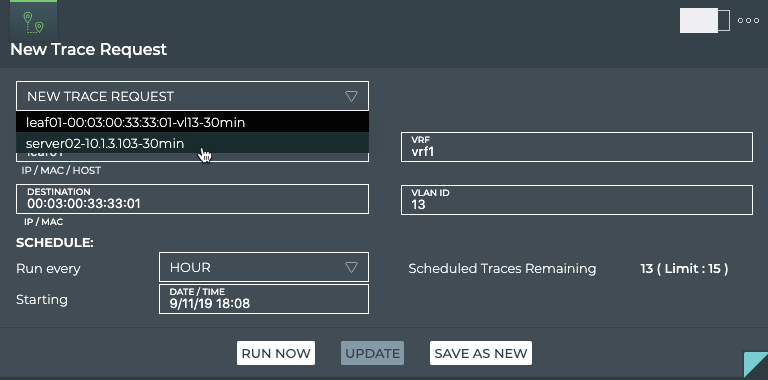
If you want to guide a trace through a particular VRF interface, you can do so using the large New Trace Request card.
To create the trace request:
-
Open the large Trace Request card.
-
In the Source field, enter the hostname or IP address of the device where you want to start the trace.
-
In the Destination field, enter the IP or MAC address of the device where you want to end the trace.
-
In the VRF field, enter the identifier for the VRF interface you want to use.
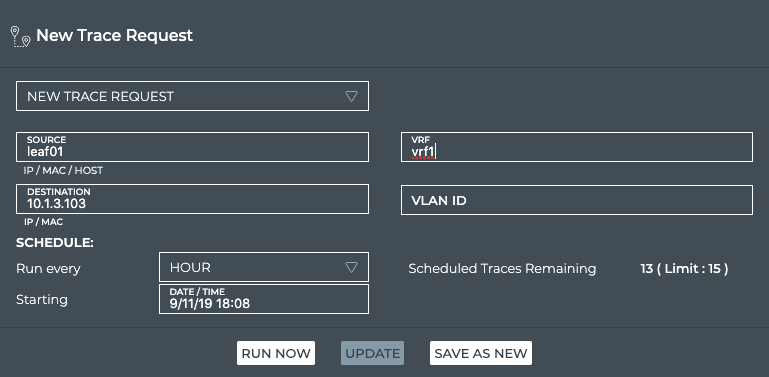
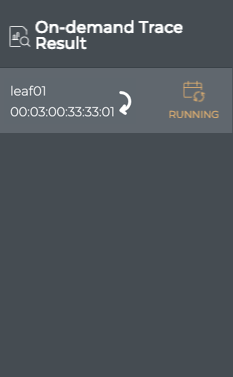
In this example, we are starting our trace at leaf01 and ending it at 10.1.3.103 using VRF vrf1.
-
Click Run Now. A corresponding Trace Results card is opened on your workbench. Refer to View Layer 3 Trace Results for details.
Create a Layer 2 Trace
It is helpful to verify the connectivity between two devices when you suspect an issue is preventing proper communication between them. If you cannot find a path through layer 2, you might try checking for connectivity through a layer 3 path.
To create a layer 2 trace request:
-
Open the large Trace Request card.
-
In the Source field, enter the hostname or MAC address of the device where you want to start the trace.
-
In the Destination field, enter the IP or MAC address for where you want to end the trace.
Remember that if you choose a MAC address as the source, you must enter a MAC address for the destination as well.
-
In the VLAN ID field, enter the identifier for the VLAN you want to use.
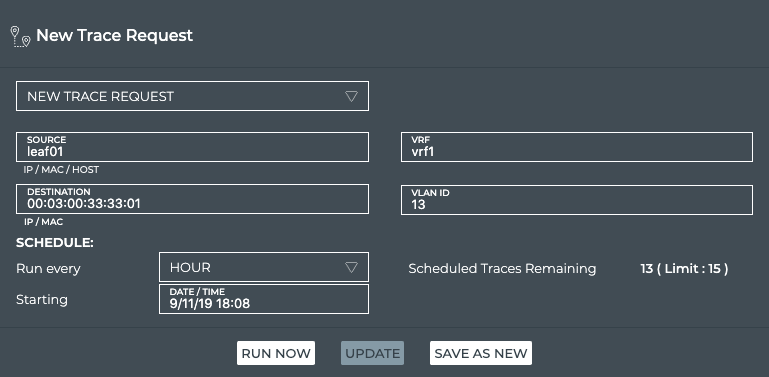
In this example, we are starting our trace at leaf01 and ending it at 00:03:00:33:33:01 using VLAN 13.
-
Click Run Now. A corresponding Trace Results card is opened on your workbench. Refer to View Layer 2 Trace Results for details.
Create a Trace to Run on a Regular Basis (Scheduled Trace)
There may be paths through your network that you consider critical to your everyday or particularly important operations. In that case, it might be useful to create one or more traces to periodically confirm that at least one path is available between the relevant two devices. Scheduling a trace request can be performed from the large Trace Request card.
To schedule a trace:
-
Open the large Trace Request card.
-
In the Source field, enter the hostname, IP address, or MAC address of the device where you want to start the trace.
-
In the Destination field, enter the IP or MAC address of the device wehre you want to end the trace.
Remember that if you choose a MAC address as the source, you must enter a MAC address for the destination as well.
-
Enter a VLAN ID (layer 2 trace) or optionally a VRF interface (layer 3 trace).
-
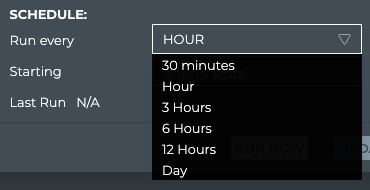
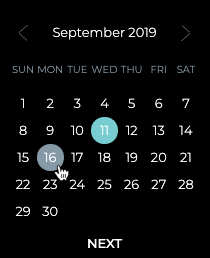
Select a timeframe under Schedule to specify how often you want to run the trace.
-
Accept the default starting time, or click in the Starting field to specify the day you want the trace to run for the first time.
-
Click Next.
-
Click the time you want the trace to run for the first time.
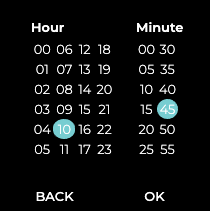
-
Click OK.
-
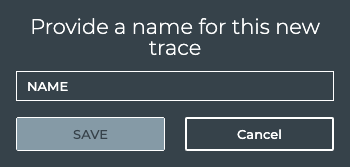
Verify your entries are correct, then click Save As New.
-
Provide a name for the trace. Note: This name must be unique for a given user.
-
Click Save.
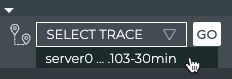
You can now run this trace on demand by selecting it from the dropdown list, or wait for it to run on its defined schedule.
Run a Scheduled Trace on Demand
You may find that, although you have a schedule for a particular trace, you want to have visibility into the connectivity data now. You can run a scheduled trace on demand from the small, medium and large Trace Request cards.
To run a scheduled trace now:
-
Open the small or medium or large Trace Request card.
-
Select the scheduled trace from the Select Trace or New Trace Request list.
Note: In the medium and large cards, the trace details are filled in on selection of the scheduled trace.
-
Click Go or Run Now. A corresponding Trace Results card is opened on your workbench.
View On-demand Trace Results
Once you have started an on-demand trace, the results are displayed in the medium Trace Results card by default. You may view the results in more or less detail by changing to the large or small Trace Results card, respectively.
On-demand Trace Results Card Workflow Summary
The small On-demand Trace Results card displays:
| Item | Description |
|---|---|
| Indicates an on-demand trace result | |
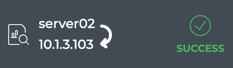
| Source and destination of the trace, identified by their address or hostname. Source is listed on top with arrow pointing to destination. | |
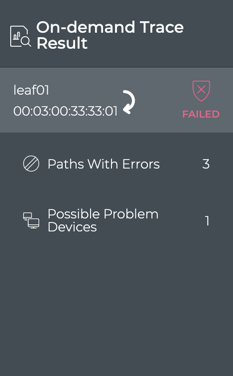
| Indicates success or failure of the trace request. A successful result implies all paths were successful without any warnings or failures. A failure result implies there was at least one path with warnings or errors. |
The medium On-demand Trace Results card displays:
| Item | Description |
|---|---|
| Indicates an on-demand trace result | |
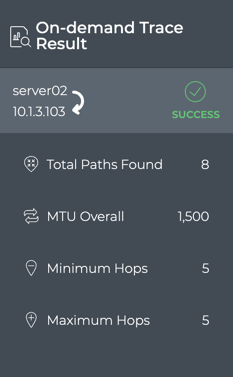
| Title | On-demand Trace Result |
| Source and destination of the trace, identified by their address or hostname. Source is listed on top with arrow pointing to destination. | |
| Indicates success or failure of the trace request. A successful result implies all paths were successful without any warnings or failures. A failure result implies there was at least one path with warnings or errors. | |
| Total Paths Found | Number of paths found between the two devices |
| MTU Overall | Average size of the maximum transmission unit for all paths |
| Minimum Hops | Smallest number of hops along a path between the devices |
| Maximum Hops | Largest number of hops along a path between the devices |
The large On-demand Trace Results card contains two tabs.
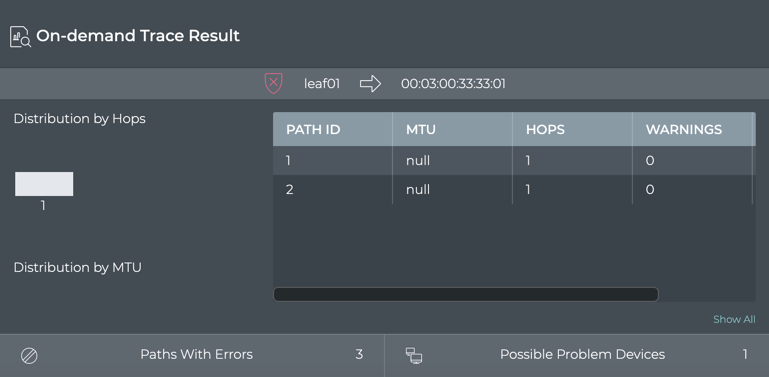
The On-demand Trace Result tab displays:
| Item | Description |
|---|---|
| Indicates an on-demand trace result | |
| Title | On-demand Trace Result |
| Indicates success or failure of the trace request. A successful result implies all paths were successful without any warnings or failures. A failure result implies there was at least one path with warnings or errors. | |
| Source and destination of the trace, identified by their address or hostname. Source is listed on top with arrow pointing to destination. | |
| Distribution by Hops chart | Displays the distributions of various hop counts for the available paths |
| Distribution by MTU chart | Displays the distribution of MTUs used on the interfaces used in the available paths |
| Table | Provides detailed path information, sorted by the route identifier, including:
|
| Total Paths Found | Number of paths found between the two devices |
| MTU Overall | Average size of the maximum transmission unit for all paths |
| Minimum Hops | Smallest number of hops along a path between the devices |
The On-demand Trace Settings tab displays:
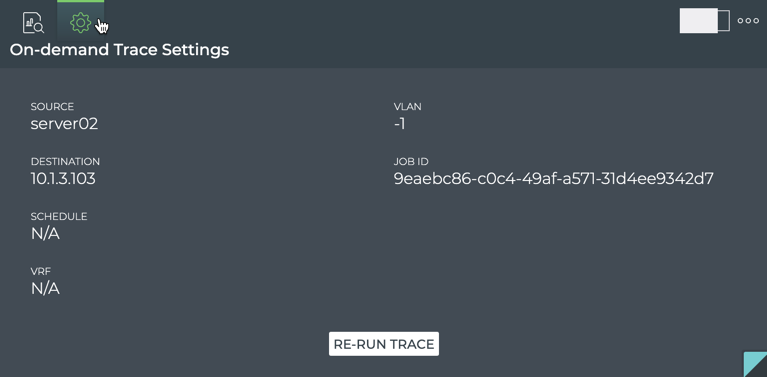
| Item | Description |
|---|---|
| Indicates an on-demand trace setting | |
| Title | On-demand Trace Settings |
| Source | Starting point for the trace |
| Destination | Ending point for the trace |
| Schedule | Does not apply to on-demand traces |
| VRF | Associated virtual route forwarding interface, when used with layer 3 traces |
| VLAN | Associated virtual local area network, when used with layer 2 traces |
| Job ID | Identifier of the job; used internally |
| Re-run Trace | Clicking this button runs the trace again |
The full screen On-demand Trace Results card displays:
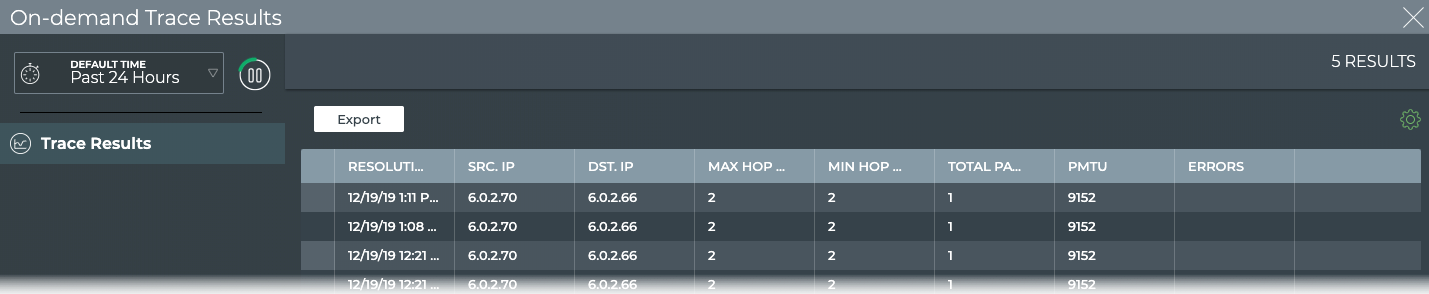
| Item | Description |
|---|---|
| Title | On-demand Trace Results |
| Closes full screen card and returns to workbench | |
| Time period | Range of time in which the displayed data was collected; applies to all card sizes; select an alternate time period by clicking |
| Results | Number of results found for the selected tab |
| Trace Results tab | Provides detailed path information, sorted by the Resolution Time (date and time results completed), including:
|
| Table Actions | Select, export, or filter the list. Refer to Table Settings. |
View Layer 2 Trace Results
When you start the trace, the corresponding results card is opened on your workbench. While it is working on the trace, a notice is shown on the card indicating it is running.
Once the job is completed, the results are displayed.
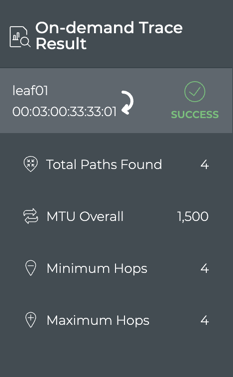
In this example, we see that the trace was successful. Four paths were found between the devices, each with four hops and with an overall MTU of 1500. If there was a difference between the minimum and maximum number of hops or other failures, viewing the results on the large card would provide additional information.
In our example, we can verify that every path option had four hops since the distribution chart only shows one hop count and the table indicates each path had a value of four hops. Similarly, you can view the MTU data. If there had been any warnings, the count would have been visible in the table.
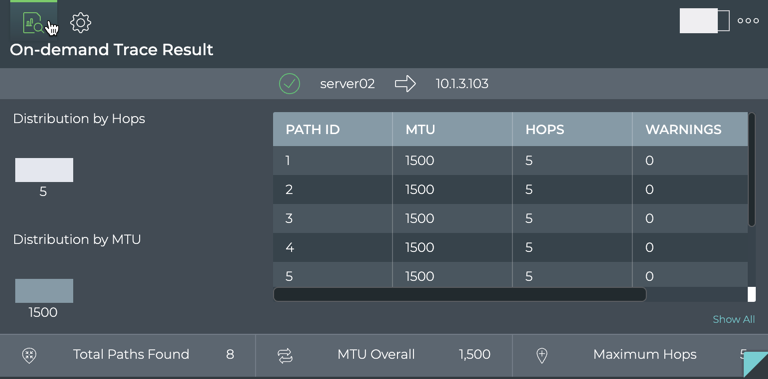
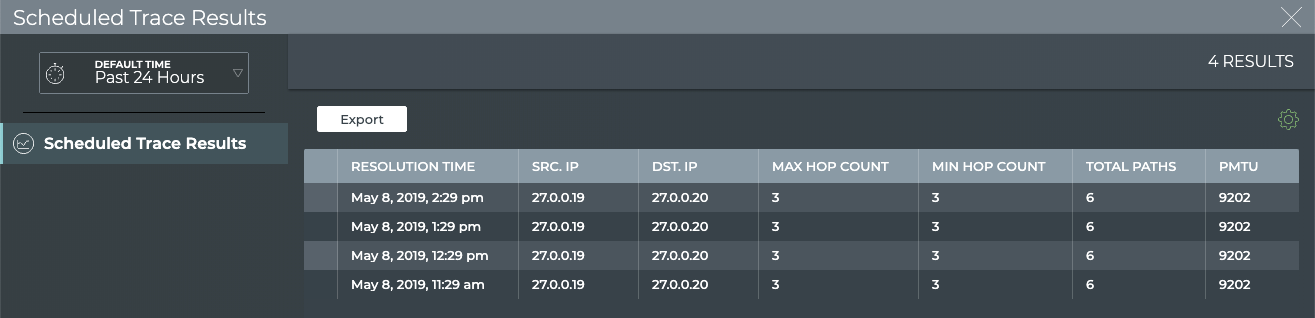
View Layer 3 Trace Results
When you start the trace, the corresponding results card is opened on your workbench. While it is working on the trace, a notice is shown on the card indicating it is running.
Once results are obtained, it displays them. Using our example from earlier, the following results are shown:
In this example, we see that the trace was successful. Six paths were found between the devices, each with five hops and with an overall MTU of 1500. If there was a difference between the minimum and maximum number of hops or other failures, viewing the results on the large card would provide additional information.
In our example, we can verify that every path option had five hops since the distribution chart only shows one hop count and the table indicates each path had a value of five hops. Similarly, you can view the MTU data. If there had been any warnings, the count would have been visible in the table.
View Detailed On-demand Trace Results
After the trace request has completed, the results are available in the corresponding medium Trace Results card.
To view the more detail:
-
Open the full-screen Trace Results card for the trace of interest.
-
Double-click on the trace of interest to open the detail view.
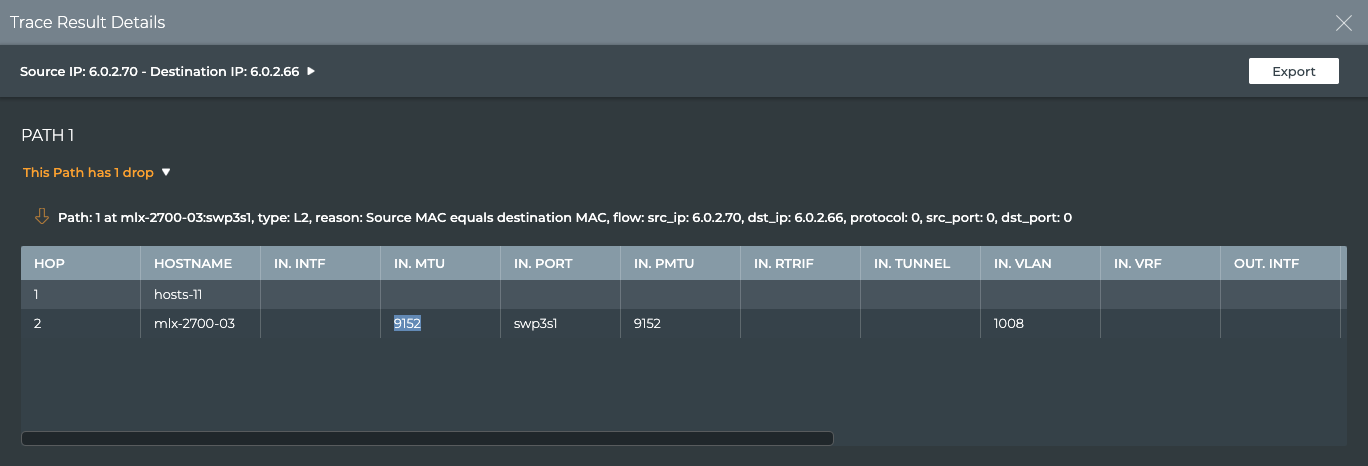
The tabular view enables you to walk through the trace path, host by host, viewing the interfaces, ports, tunnels, VLANs, and so forth used to traverse the network from the source to the destination.
-
If the trace was run on a Mellanox switch and drops were detected by the What Just Happened feature, they are identified above the path. Click the down arrow to view the list of drops and their details. Click the up arrow to close the list.
View Scheduled Trace Results
You can view the results of scheduled traces at any time. Results are displayed on the Scheduled Trace Results cards.
Scheduled Trace Results Card Workflow Summary
The small Scheduled Trace Results card displays:
| Item | Description |
|---|---|
| Indicates a scheduled trace result | |
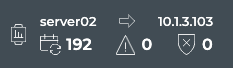
| Source and destination of the trace, identified by their address or hostname. Source is listed on left with arrow pointing to destination. | |
| Results | Summary of trace results: a successful result implies all paths were successful without any warnings or failures; a failure result implies there was at least one path with warnings or errors.
|
The medium Scheduled Trace Results card displays:
| Item | Description |
|---|---|
| Time period | Range of time in which the displayed data was collected; applies to all card sizes |
| Indicates a scheduled trace result | |
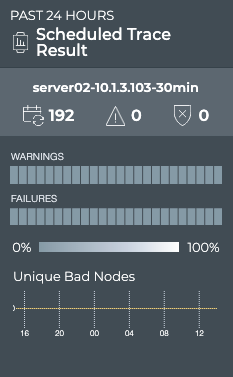
| Title | Scheduled Trace Result |
| Summary | Name of scheduled validation and summary of trace results: a successful result implies all paths were successful without any warnings or failures; a failure result implies there was at least one path with warnings or errors.
|
| Charts | Heat map: A time segmented view of the results. For each time segment, the color represents the percentage of warning and failed results. Refer to Granularity of Data Shown Based on Time Period for details on how to interpret the results. Unique Bad Nodes: Distribution of unique nodes that generated the indicated warnings and/or failures |
The large Scheduled Trace Results card contains two tabs:
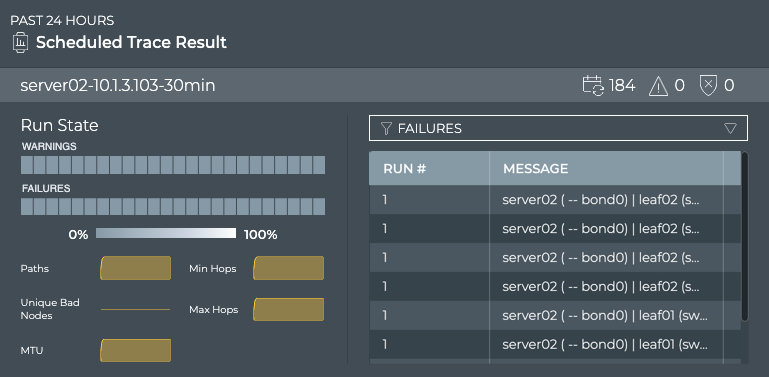
The Results tab displays:
| Item | Description |
|---|---|
| Time period | Range of time in which the displayed data was collected; applies to all card sizes |
| Indicates a scheduled trace result | |
| Title | Scheduled Trace Result |
| Summary | Name of scheduled validation and summary of trace results: a successful result implies all paths were successful without any warnings or failures; a failure result implies there was at least one path with warnings or errors.
|
| Charts | Heat map: A time segmented view of the results. For each time segment, the color represents the percentage of warning and failed results. Refer to Granularity of Data Shown Based on Time Period for details on how to interpret the results. Small charts: Display counts for each item during the same time period, for the purpose of correlating with the warnings and errors shown in the heat map. |
| Table/Filter options | When the Failures filter option is selected, the table displays the failure messages received for each run. When the Paths filter option is selected, the table displays all of the paths tried during each run. When the Warning filter option is selected, the table displays the warning messages received for each run. |
The Configuration tab displays:
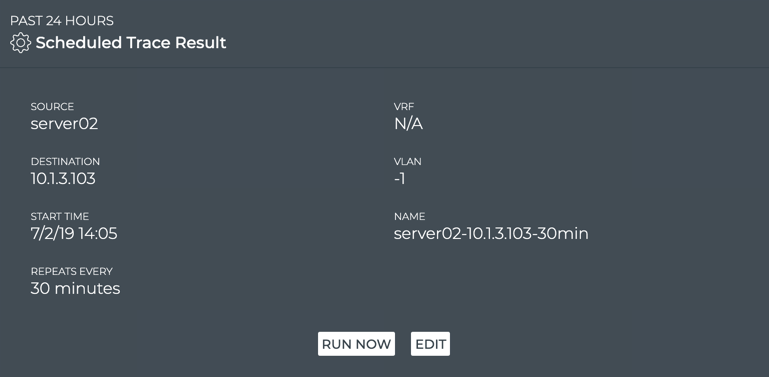
| Item | Description |
|---|---|
| Time period | Range of time in which the displayed data was collected; applies to all card sizes |
| Indicates a scheduled trace configuration | |
| Title | Scheduled Trace Configuration (Scheduled Trace Result) |
| Source | Address or hostname of the device where the trace was started |
| Destination | Address of the device where the trace was stopped |
| Schedule | The frequency and starting date and time to run the trace |
| VRF | Virtual Route Forwarding interface, when defined |
| VLAN | Virtual LAN identifier, when defined |
| Name | User-defined name of the scheduled trace |
| Run Now | Start the trace now |
| Edit | Modify the trace. Opens Trace Request card with this information pre-populated. |
The full screen Scheduled Trace Results card displays:
| Item | Description |
|---|---|
| Title | Scheduled Trace Results |
| Closes full screen card and returns to workbench | |
| Time period | Range of time in which the displayed data was collected; applies to all card sizes; select an alternate time period by clicking |
| Results | Number of results found for the selected tab |
| Scheduled Trace Results tab | Displays the basic information about the trace, including:
Click on a result to open a detailed view of the results. |
| Table Actions | Select, export, or filter the list. Refer to Table Settings. |
Granularity of Data Shown Based on Time Period
On the medium and large Trace Result cards, the status of the runs is represented in heat maps stacked vertically; one for runs with warnings and one for runs with failures. Depending on the time period of data on the card, the number of smaller time blocks used to indicate the status varies. A vertical stack of time blocks, one from each map, includes the results from all checks during that time. The results are shown by how saturated the color is for each block. If all traces run during that time period pass, then both blocks are 100% gray. If there are only failures, the associated lower blocks are 100% saturated white and the warning blocks are 100% saturated gray. As warnings and failures increase, the blocks increase their white saturation. As warnings or failures decrease, the blocks increase their gray saturation. An example heat map for a time period of 24 hours is shown here with the most common time periods in the table showing the resulting time blocks.
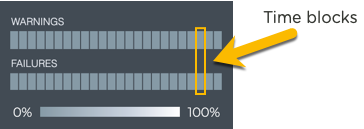
| Time Period | Number of Runs | Number Time Blocks | Amount of Time in Each Block |
|---|---|---|---|
| 6 hours | 18 | 6 | 1 hour |
| 12 hours | 36 | 12 | 1 hour |
| 24 hours | 72 | 24 | 1 hour |
| 1 week | 504 | 7 | 1 day |
| 1 month | 2,086 | 30 | 1 day |
| 1 quarter | 7,000 | 13 | 1 week |
View Detailed Scheduled Trace Results
Once a scheduled trace request has completed, the results are available in the corresponding Trace Result card.
To view the results:
-
Open the full screen Trace Request card to view all scheduled traces that have been run.
-
Select the scheduled trace you want to view results for by clicking in the first column of the result and clicking the check box.
-
On the Edit Menu that appears at the bottom of the window, click
 (Open Cards). This opens the medium Scheduled Trace Results card(s) for the selected items.
-
Note the distribution of results. Are there many failures? Are they concentrated together in time? Has the trace begun passing again?
-
Hover over the heat maps to view the status numbers and what percentage of the total results that represents for a given region.
-
Switch to the large Scheduled Trace Result card.
-
If there are a large number of warnings or failures, view the associated messages by selecting Failures or Warning in the filter above the table. This might help narrow the failures down to a particular device or small set of devices that you can investigate further.
-
Look for a consistent number of paths, MTU, hops in the small charts under the heat map. Changes over time here might correlate with the messages and give you a clue to any specific issues. Note if the number of bad nodes changes over time. Devices that become unreachable are often the cause of trace failures.
-
View the available paths for each run, by selecting Paths in the filter above the table.
-
You can view the configuration of the request that produced the results shown on this card workflow, by hovering over the card and clicking
 . If you want to change the configuration, click Edit to open the large Trace Request card, pre-populated with the current configuration. Follow the instructions in Create a Scheduled Trace Request to make your changes in the same way you created a new scheduled trace.
 -
To view a summary of all scheduled trace results, switch to the full screen card.
-
Look for changes and patterns in the results for additional clues to isolate root causes of trace failures. Select and view related traces using the Edit menu.
-
View the details of any specific trace result by clicking on the trace. A new window opens similar to the following:
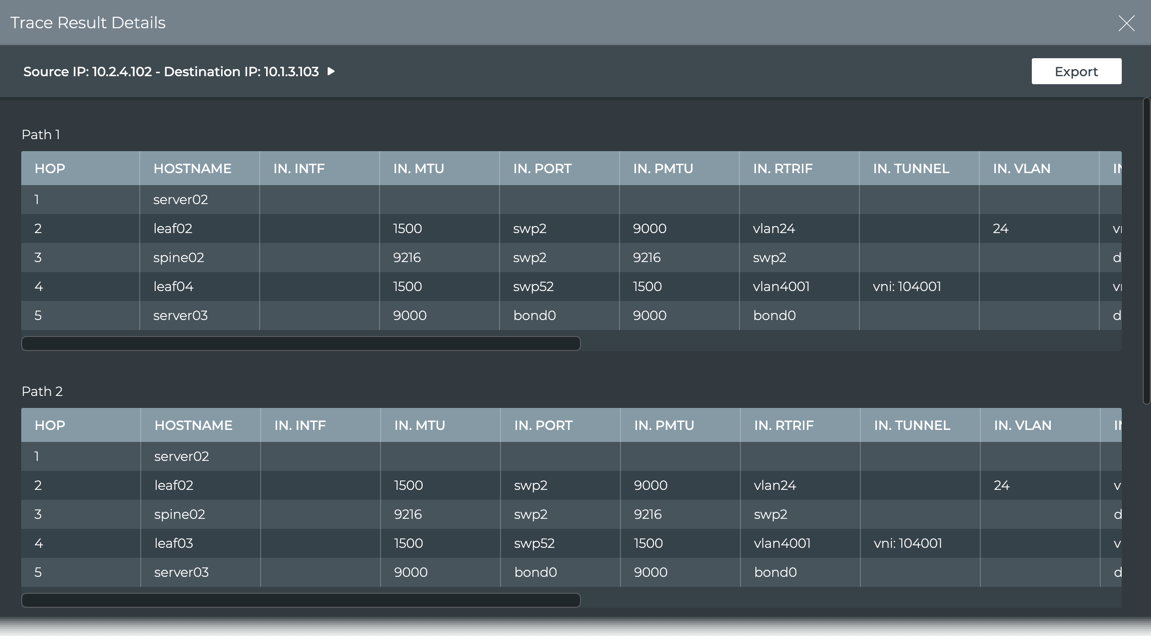
Scroll to the right to view the information for a given hop. Scroll down to view additional paths. This display shows each of the hosts and detailed steps the trace takes to validate a given path between two devices. Using Path 1 as an example, each path can be interpreted as follows:
- Hop 1 is from the source device, server02 in this case.
- It exits this device at switch port bond0 with an MTU of 9000 and over the default VRF to get to leaf02.
- The trace goes in to swp2 with an MTU of 9216 over the vrf1 interface.
- It exits leaf02 through switch port 52 and so on.
-
Export this data by clicking Export or click
 to return to the results list to view another trace in detail.