Monitor Network Elements
In addition to network performance monitoring, the Cumulus NetQ UI provides a view into the current status and configuration of the network elements in a tabular, network-wide view. These are helpful when you want to see all data for all of a particular element in your network for troubleshooting, or you want to export a list view.
Some of these views provide data that is also available through the card workflows, but these views are not treated like cards. They only provide the current status; you cannot change the time period of the views, or graph the data within the UI.
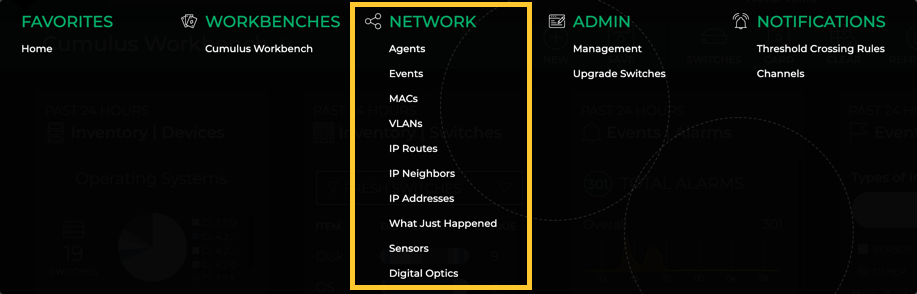
Access these tables through the Main Menu (![]() ), under the Network heading.
), under the Network heading.
If you do not have administrative rights, the Admin menu options are not available to you.
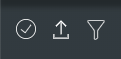
Tables can be manipulated using the settings above the tables, shown here and described in Table Settings.
Pagination options are shown when there are more than 25 results.
View All NetQ Agents
The Agents view provides all available parameter data about all NetQ Agents in the system.
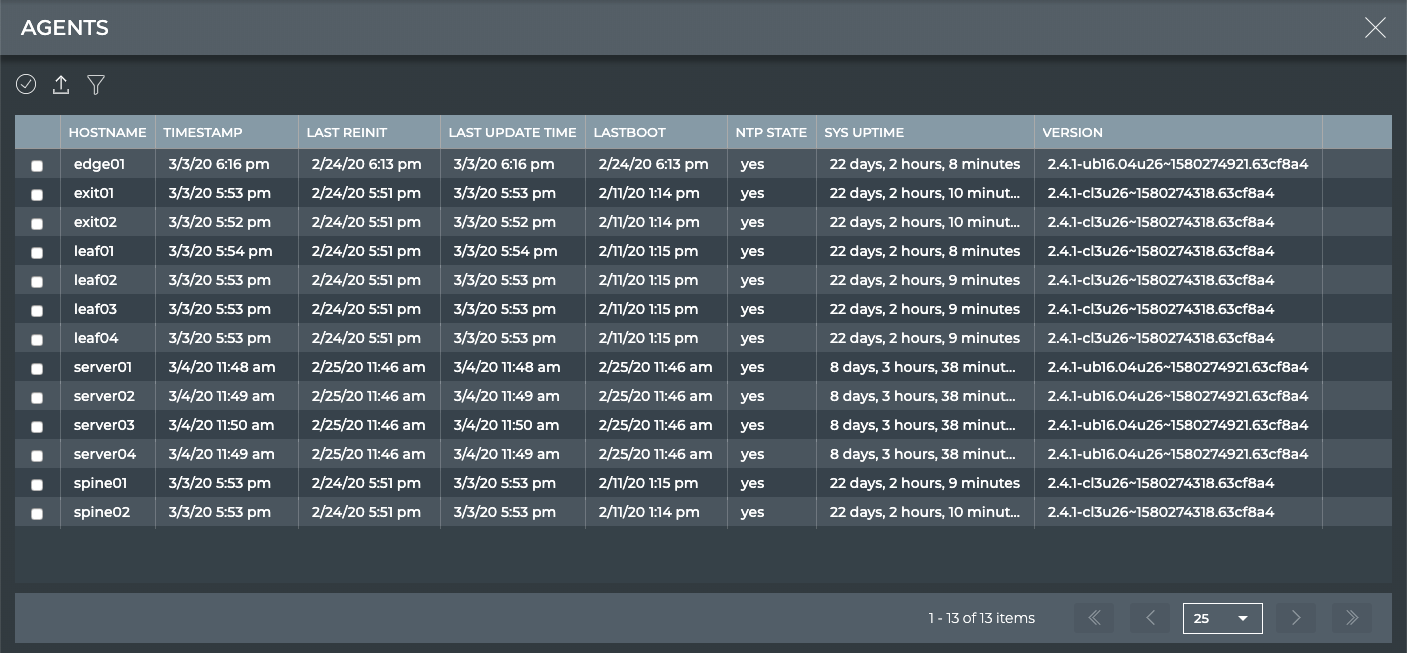
| Parameter | Description |
|---|---|
| Hostname | Name of the switch or host |
| Timestamp | Date and time the data was captured |
| Last Reinit | Date and time that the switch or host was reinitialized |
| Last Update Time | Date and time that the switch or host was updated |
| Lastboot | Date and time that the switch or host was last booted up |
| NTP State | Status of NTP synchronization on the switch or host; yes = in synchronization, no = out of synchronization |
| Sys Uptime | Amount of time the switch or host has been continuously up and running |
| Version | NetQ version running on the switch or host |
View All Events
The Events view provides all available parameter data about all events in the system.
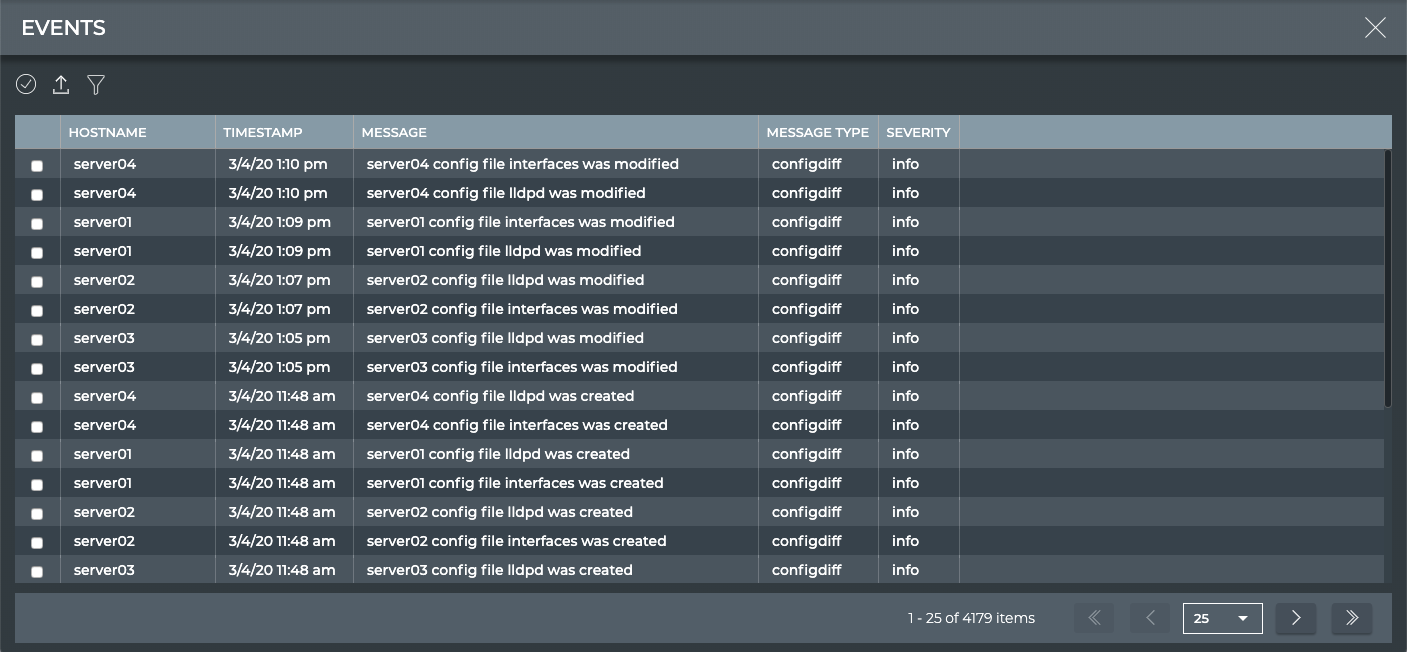
| Parameter | Description |
|---|---|
| Hostname | Name of the switch or host that experienced the event |
| Timestamp | Date and time the event was captured |
| Message | Description of the event |
| Message Type | Network service or protocol that generated the event |
| Severity | Importance of the event. Values include critical, warning, info, and debug. |
View All MACs
The MACs (media access control addresses) view provides all available parameter data about all MAC addresses in the system.
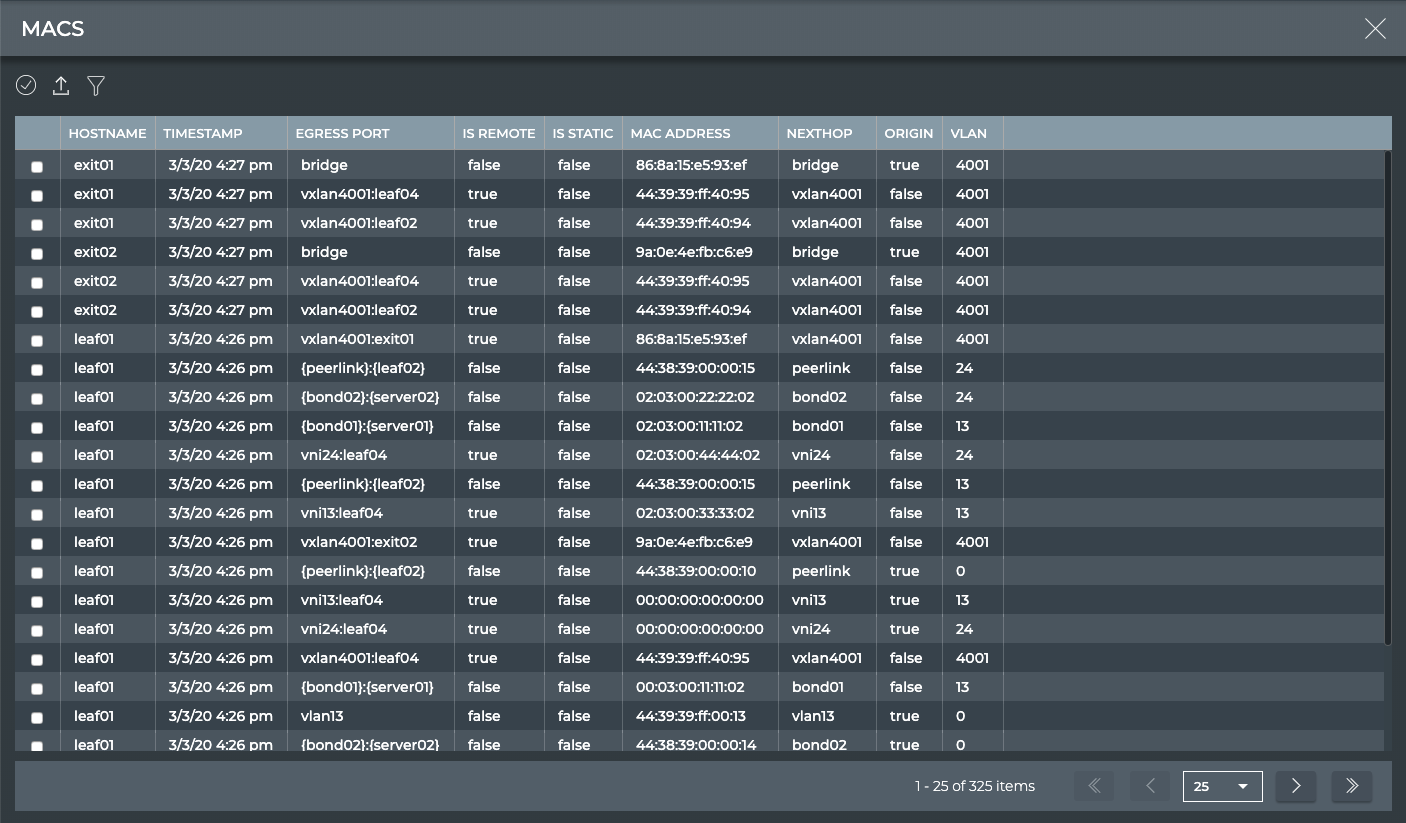
| Parameter | Description |
|---|---|
| Hostname | Name of the switch or host where the MAC address resides |
| Timestamp | Date and time the data was captured |
| Egress Port | Port where traffic exits the switch or host |
| Is Remote | Indicates if the address is |
| Is Static | Indicates if the address is a static (true) or dynamic assignment (false) |
| MAC Address | MAC address |
| Nexthop | Next hop for traffic hitting this MAC address on this switch or host |
| Origin | Indicates if address is owned by this switch or host (true) or by a peer (false) |
| VLAN | VLAN associated with the MAC address, if any |
View All VLANs
The VLANs (virtual local area networks) view provides all available parameter data about all VLANs in the system.
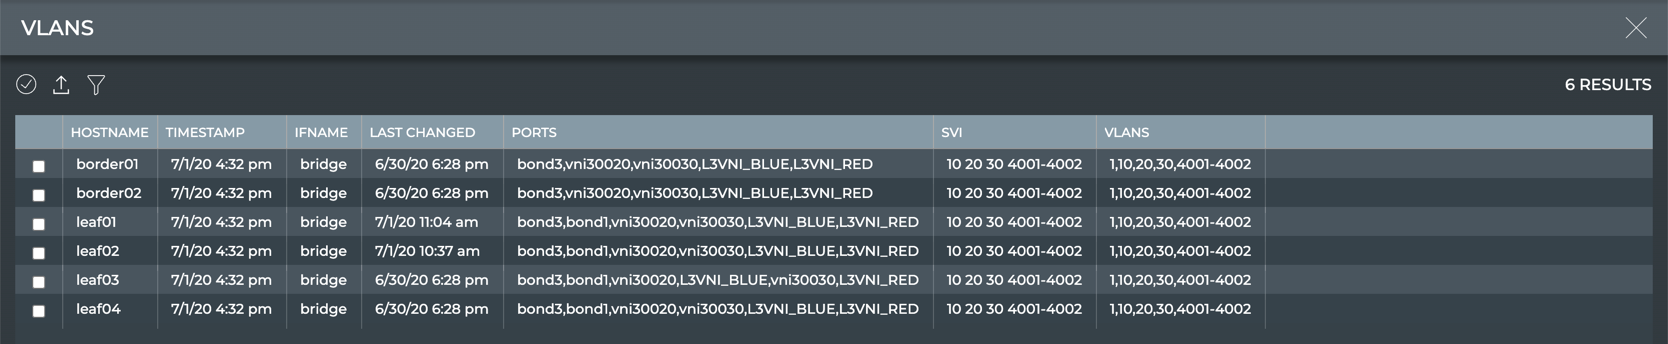
| Parameter | Description |
|---|---|
| Hostname | Name of the switch or host where the VLAN(s) reside(s) |
| Timestamp | Date and time the data was captured |
| If Name | Name of interface used by the VLAN(s) |
| Last Changed | Date and time when this information was last updated |
| Ports | Ports on the switch or host associated with the VLAN(s) |
| SVI | Switch virtual interface associated with a bridge interface |
| VLANs | VLANs associated with the switch or host |
View IP Routes
The IP Routes view provides all available parameter data about all IP routes. The list of routes can be filtered to view only the IPv4 or IPv6 routes by selecting the relevant tab.
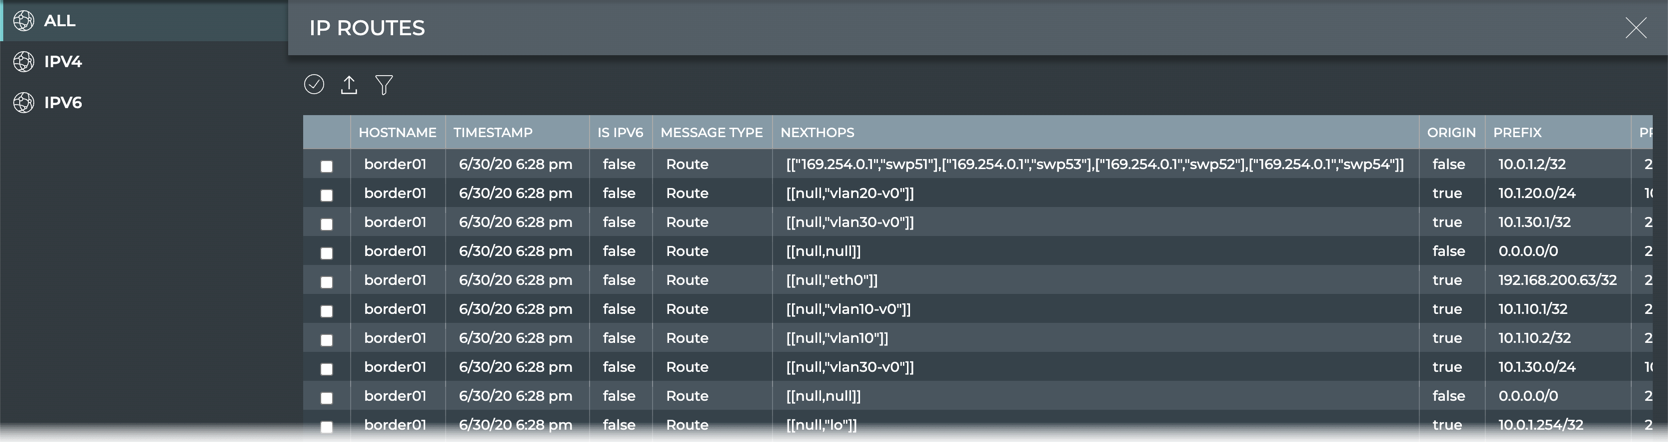
| Parameter | Description |
|---|---|
| Hostname | Name of the switch or host where the VLAN(s) reside(s) |
| Timestamp | Date and time the data was captured |
| Is IPv6 | Indicates if the address is an IPv6 (true) or IPv4 (false) address |
| Message Type | Network service or protocol; always Route in this table |
| Nexthops | Possible ports/interfaces where traffic can be routed to next |
| Origin | Indicates if this switch or host is the source of this route (true) or not (false) |
| Prefix | IPv4 or IPv6 address prefix |
| Priority | Rank of this route to be used before another, where the lower the number, less likely is to be used; value determined by routing protocol |
| Protocol | Protocol responsible for this route |
| Route Type | Type of route |
| Rt Table ID | The routing table identifier where the route resides |
| Src | Prefix of the address where the route is coming from (the previous hop) |
| VRF | Associated virtual route interface associated with this route |
View IP Neighbors
The IP Neighbors view provides all available parameter data about all IP neighbors. The list of neighbors can be filtered to view only the IPv4 or IPv6 neighbors by selecting the relevant tab.
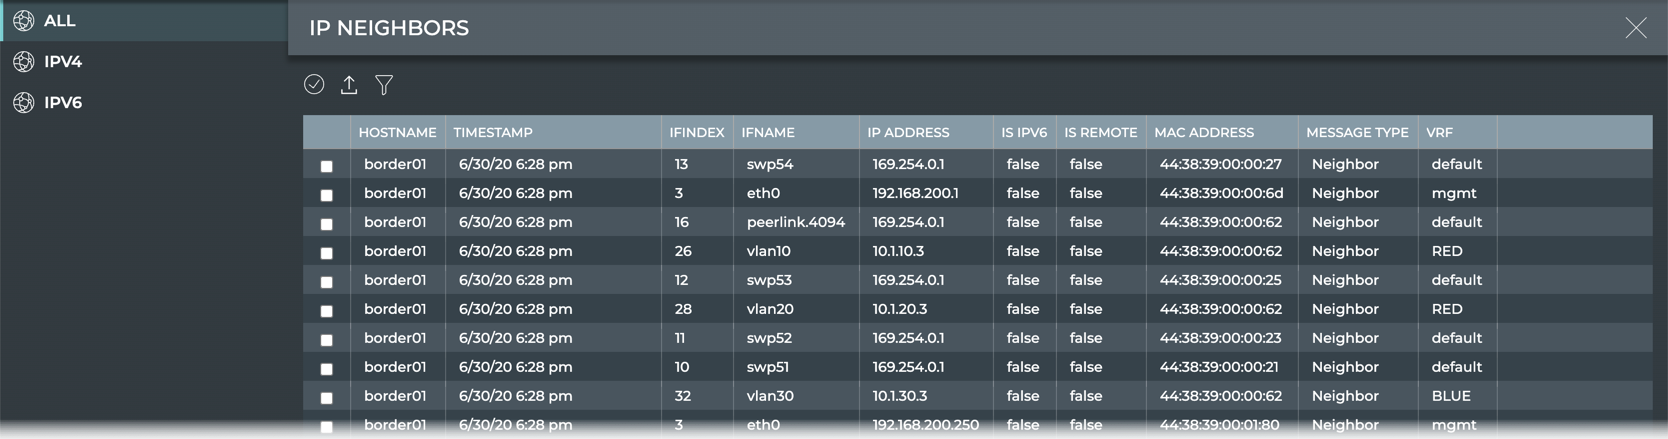
| Parameter | Description |
|---|---|
| Hostname | Name of the neighboring switch or host |
| Timestamp | Date and time the data was captured |
| IF Index | Index of interface used to communicate with this neighbor |
| If Name | Name of interface used to communicate with this neighbor |
| IP Address | IPv4 or IPv6 address of the neighbor switch or host |
| Is IPv6 | Indicates if the address is an IPv6 (true) or IPv4 (false) address |
| Is Remote | Indicates if the address is |
| MAC Address | MAC address of the neighbor switch or host |
| Message Type | Network service or protocol; always Neighbor in this table |
| VRF | Associated virtual route interface associated with this neighbor |
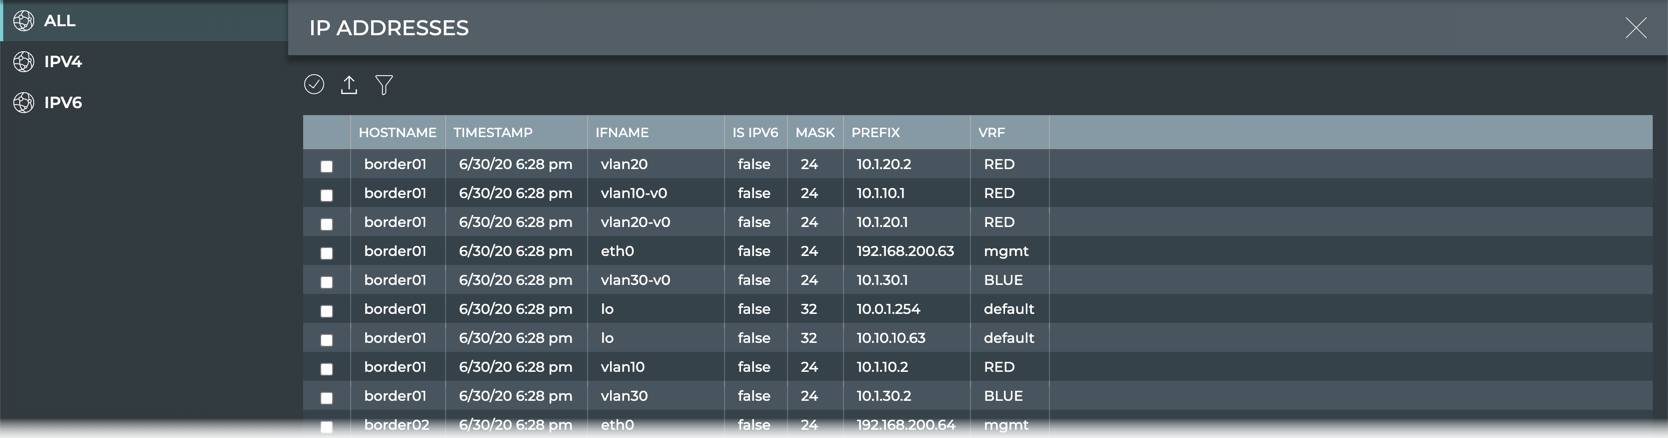
View IP Addresses
The IP Addresses view provides all available parameter data about all IP addresses. The list of addresses can be filtered to view only the IPv4 or IPv6 addresses by selecting the relevant tab.
| Parameter | Description |
|---|---|
| Hostname | Name of the neighboring switch or host |
| Timestamp | Date and time the data was captured |
| If Name | Name of interface used to communicate with this neighbor |
| Is IPv6 | Indicates if the address is an IPv6 (true) or IPv4 (false) address |
| Mask | Host portion of the address |
| Prefix | Network portion of the address |
| VRF | Virtual route interface associated with this address prefix and interface on this switch or host |
View What Just Happened
The What Just Happened (WJH) feature, available on Mellanox switches, streams detailed and contextual telemetry data for analysis. This provides real-time visibility into problems in the network, such as hardware packet drops due to buffer congestion, incorrect routing, and ACL or layer 1 problems. You must have Cumulus Linux 4.0.0 or later and NetQ 2.4.0 or later to take advantage of this feature.
If your switches are sourced from a vendor other than Mellanox, this view is blank as no data is collected.
When WJH capabilities are combined with Cumulus NetQ, you have the ability to hone in on losses, anywhere in the fabric, from a single management console. You can:
- View any current or historic drop information, including the reason for the drop
- Identify problematic flows or endpoints, and pin-point exactly where communication is failing in the network
By default, Cumulus Linux 4.0.0 provides the NetQ 2.3.1 Agent and CLI. If you installed Cumulus Linux 4.0.0 on your Mellanox switch, you need to upgrade the NetQ Agent and optionally the CLI to release 2.4.0 or later (preferably the latest release).
cumulus@<hostname>:~$ sudo apt-get update
cumulus@<hostname>:~$ sudo apt-get install -y netq-agent
cumulus@<hostname>:~$ netq config restart agent
cumulus@<hostname>:~$ sudo apt-get install -y netq-apps
cumulus@<hostname>:~$ netq config restart cli
Configure the WJH Feature
WJH is enabled by default on Mellanox switches and no configuration is required in Cumulus Linux 4.0.0; however, you must enable the NetQ Agent to collect the data in NetQ 2.4.0 or later.
To enable WJH in NetQ:
-
Configure the NetQ Agent on the Mellanox switch.
cumulus@switch:~$ netq config add agent wjh -
Restart the NetQ Agent to start collecting the WJH data.
cumulus@switch:~$ netq config restart agent
When you are finished viewing the WJH metrics, you might want to disable the NetQ Agent to reduce network traffic. Use netq config del agent wjh followed by netq config restart agent to disable the WJH feature on the given switch.
Using wjh_dump.py on a Mellanox platform that is running Cumulus Linux 4.0 and the NetQ 2.4.0 agent causes the NetQ WJH client to stop receiving packet drop call backs. To prevent this issue, run wjh_dump.py on a different system than the one where the NetQ Agent has WJH enabled, or disable wjh_dump.py and restart the NetQ Agent (run netq config restart agent).
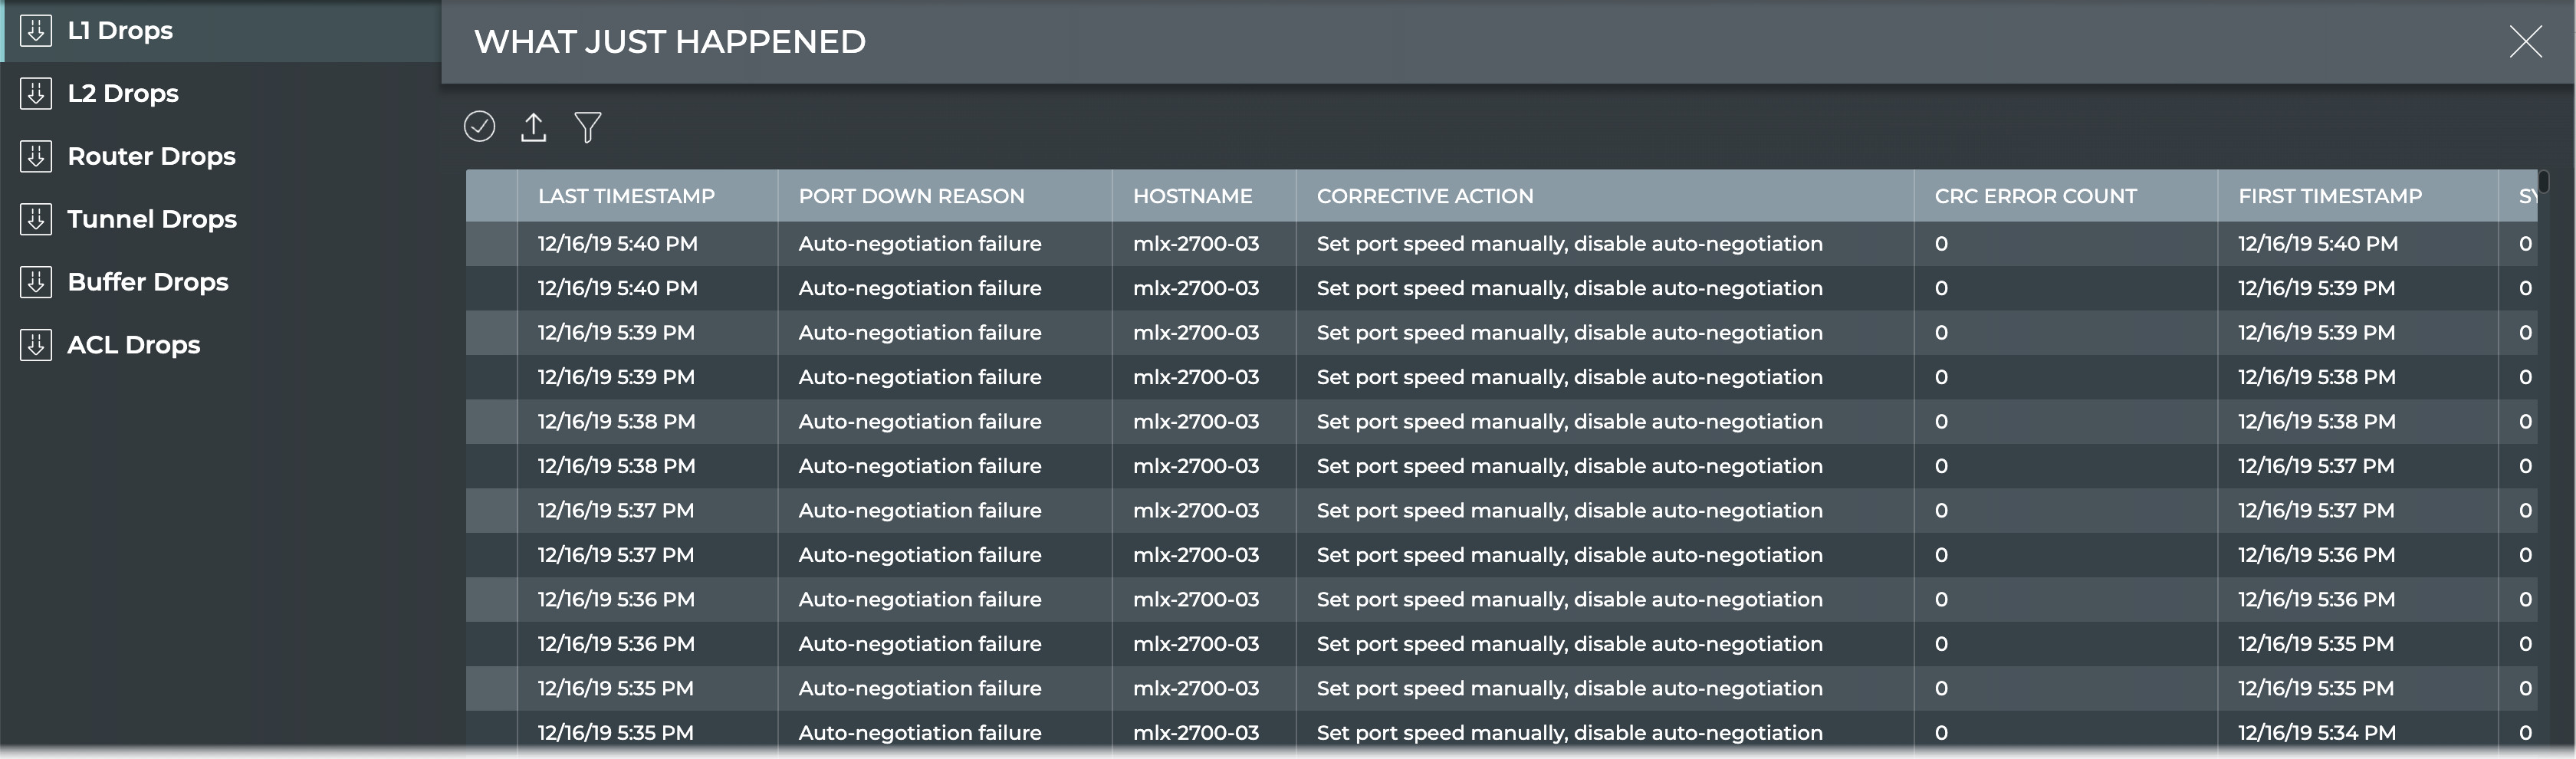
View What Just Happened Metrics
The What Just Happened view displays events based on conditions detected in the data plane. The most recent 1000 events from the last 24 hours are presented for each drop category.
| Tab | Description |
|---|---|
| L1 Drops | Displays the reason why a port is in the down state. By default, the listing is sorted by Last Timestamp. The tab provides the following additional data about each drop event:
|
| L2 Drops | Displays the reason for a link to be down. By default, the listing is sorted by Last Timestamp. The tab provides the following additional data about each drop event:
|
| Router Drops | Displays the reason why the server is unable to route a packet. By default, the listing is sorted by Last Timestamp. The tab provides the following additional data about each drop event:
|
| Tunnel Drops | Displays the reason for a tunnel to be down. By default, the listing is sorted by Last Timestamp. The tab provides the following additional data about each drop event:
|
| Buffer Drops | Displays the reason for the server buffer to be drop packets. By default, the listing is sorted by Last Timestamp. The tab provides the following additional data about each drop event:
|
| ACL Drops | Displays the reason for an ACL to drop packets. By default, the listing is sorted by Last Timestamp. The tab provides the following additional data about each drop event:
|
View Sensors
The Sensors view provides all available parameter data provided by the power supply units (PSUs), fans, and temperature sensors in the system. Select the relevant tab to view the data.
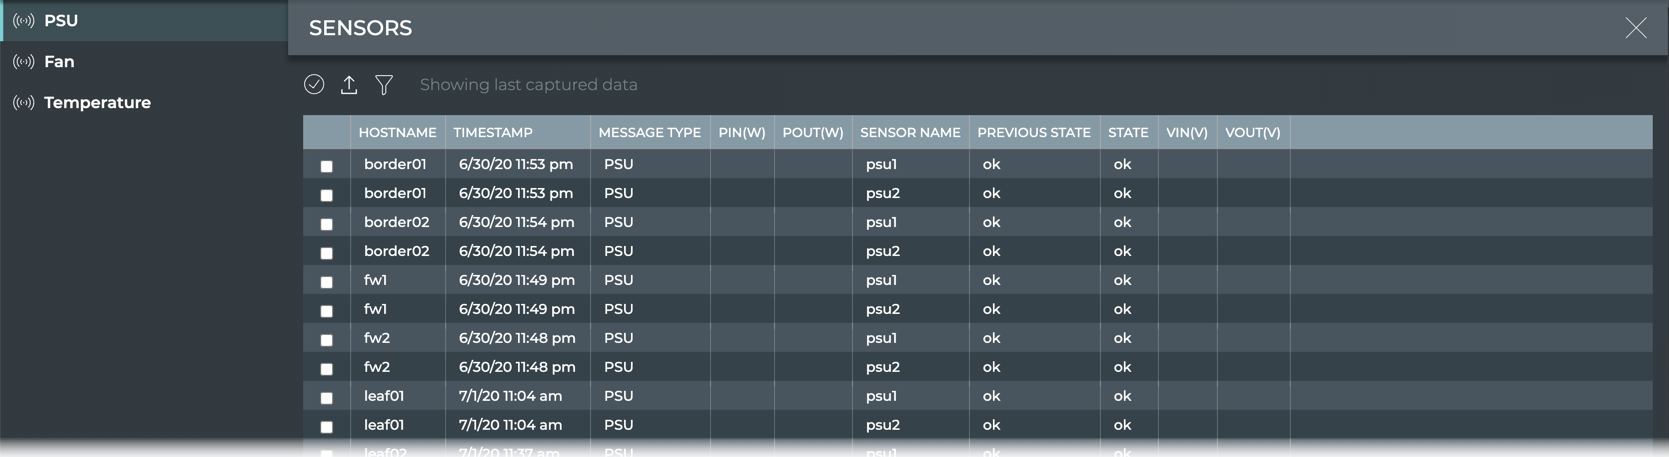
| PSU Parameter | Description |
|---|---|
| Hostname | Name of the switch or host where the power supply is installed |
| Timestamp | Date and time the data was captured |
| Message Type | Type of sensor message; always PSU in this table |
| PIn(W) | Input power (Watts) for the PSU on the switch or host |
| POut(W) | Output power (Watts) for the PSU on the switch or host |
| Sensor Name | User-defined name for the PSU |
| Previous State | State of the PSU when data was captured in previous window |
| State | State of the PSU when data was last captured |
| VIn(V) | Input voltage (Volts) for the PSU on the switch or host |
| VOut(V) | Output voltage (Volts) for the PSU on the switch or host |
| Fan Parameter | Description |
|---|---|
| Hostname | Name of the switch or host where the fan is installed |
| Timestamp | Date and time the data was captured |
| Message Type | Type of sensor message; always Fan in this table |
| Description | User specified description of the fan |
| Speed (RPM) | Revolution rate of the fan (revolutions per minute) |
| Max | Maximum speed (RPM) |
| Min | Minimum speed (RPM) |
| Message | Message |
| Sensor Name | User-defined name for the fan |
| Previous State | State of the fan when data was captured in previous window |
| State | State of the fan when data was last captured |
| Temperature Parameter | Description |
|---|---|
| Hostname | Name of the switch or host where the temperature sensor is installed |
| Timestamp | Date and time the data was captured |
| Message Type | Type of sensor message; always Temp in this table |
| Critical | Current critical maximum temperature (°C) threshold setting |
| Description | User specified description of the temperature sensor |
| Lower Critical | Current critical minimum temperature (°C) threshold setting |
| Max | Maximum temperature threshold setting |
| Min | Minimum temperature threshold setting |
| Message | Message |
| Sensor Name | User-defined name for the temperature sensor |
| Previous State | State of the fan when data was captured in previous window |
| State | State of the fan when data was last captured |
| Temperature(Celsius) | Current temperature (°C) measured by sensor |
View Digital Optics
The Digital Optics view provides all available parameter data provided by any digital optics modules in the system. View Laser power and bias current for a given interface and channel on a switch, and temperature and voltage for a given module. Select the relevant tab to view the data.
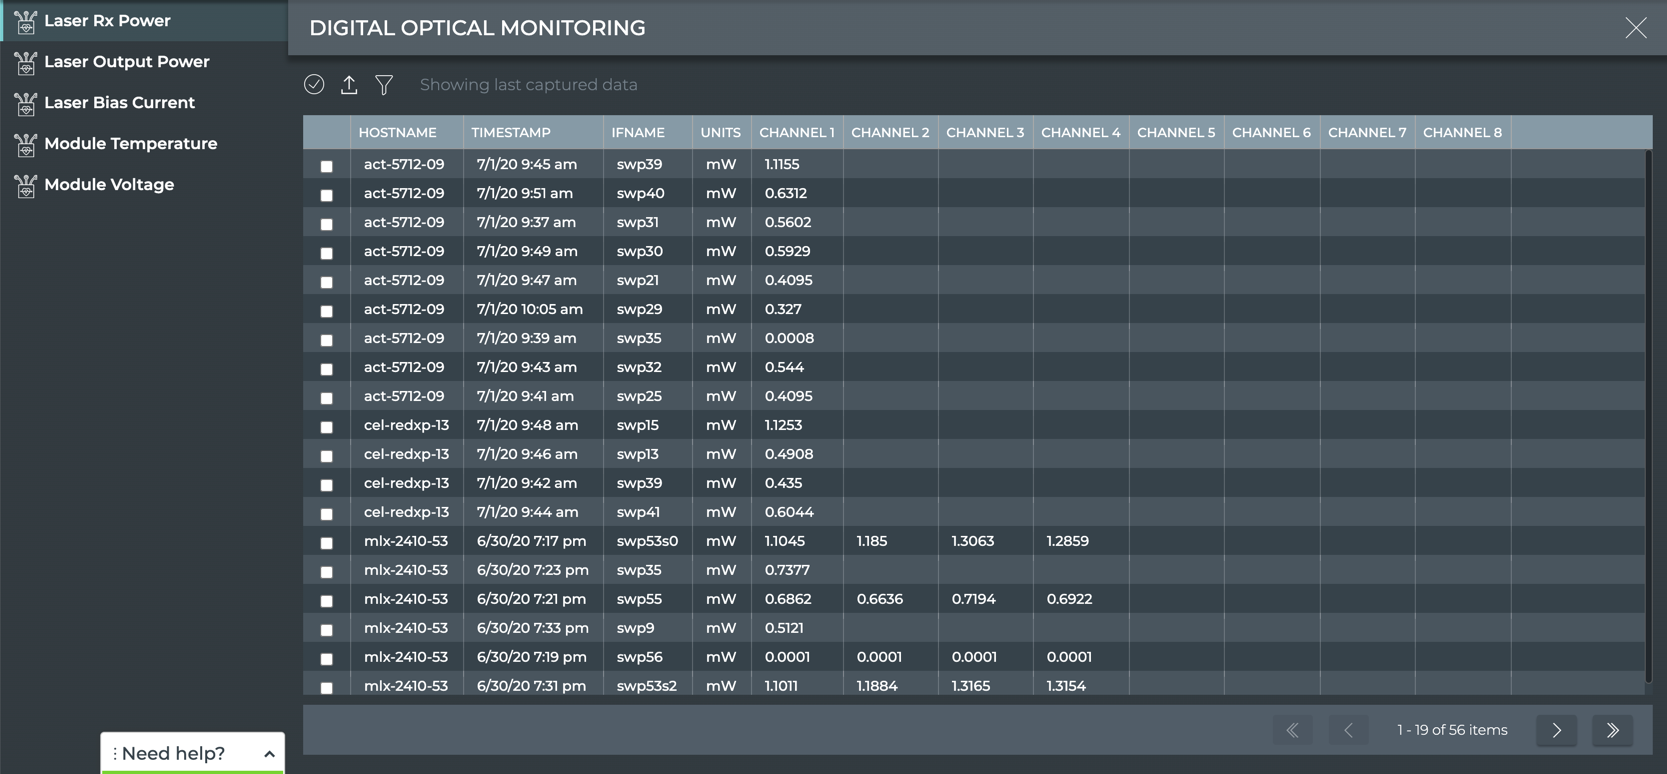
| Laser Parameter | Description |
|---|---|
| Hostname | Name of the switch or host where the digital optics module resides |
| Timestamp | Date and time the data was captured |
| If Name | Name of interface where the digital optics module is installed |
| Units | Measurement unit for the power (mW) or current (mA) |
| Channel 1–8 | Value of the power or current on each channel where the digital optics module is transmitting |
| Module Parameter | Description |
|---|---|
| Hostname | Name of the switch or host where the digital optics module resides |
| Timestamp | Date and time the data was captured |
| If Name | Name of interface where the digital optics module is installed |
| Degree C | Current module temperature, measured in degrees Celsius |
| Degree F | Current module temperature, measured in degrees Fahrenheit |
| Units | Measurement unit for module voltage; Volts |
| Value | Current module voltage |