Monitor Informational Events
You can easily monitor warning, info, and debug severity events occurring across your network using the Info card. You can determine the number of events for the various system, interface, and network protocols and services components in the network. The content of the cards in the workflow is described first, and then followed by common tasks you would perform using this card workflow.
Info Card Workflow Summary
The Info card workflow enables users to easily view and track informational alarms occurring anywhere in your network.
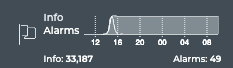
The small Info card displays:
| Item | Description |
|---|---|
| Indicates data is for all warning, info, and debug severity events in the network | |
| Info count | Number of info events received during the designated time period |
| Alarm count | Number of alarm events received during the designated time period |
| Chart | Distribution of all info events and alarms received during the designated time period |
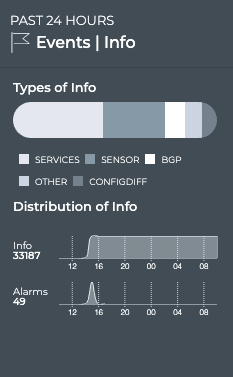
The medium Info card displays:
| Item | Description |
|---|---|
| Time period | Range of time in which the displayed data was collected; applies to all card sizes |
| Indicates data is for all warning, info, and debug severity events in the network | |
| Types of Info | Chart which displays the services that have triggered events during the designated time period. Hover over chart to view a count for each type. |
| Distribution of Info | Info Status
|
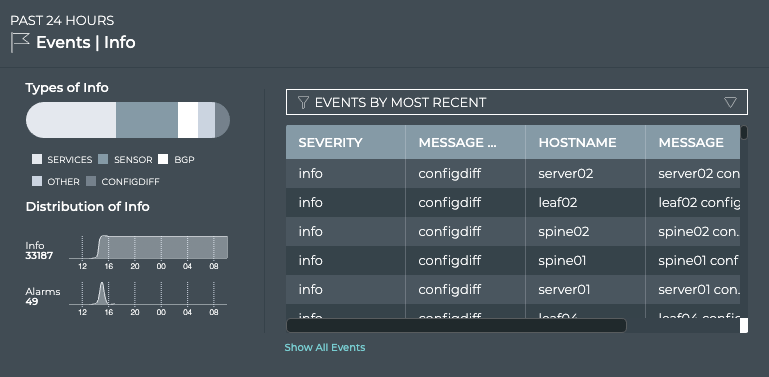
The large Info card displays:
| Item | Description |
|---|---|
| Time period | Range of time in which the displayed data was collected; applies to all card sizes |
| Indicates data is for all warning, info, and debug severity events in the network | |
| Types of Info | Chart which displays the services that have triggered events during the designated time period. Hover over chart to view a count for each type. |
| Distribution of Info | Info Status
|
| Table | Listing of items that match the filter selection:
|
| Show All Events | Opens full screen Events | Info card with a listing of all events |
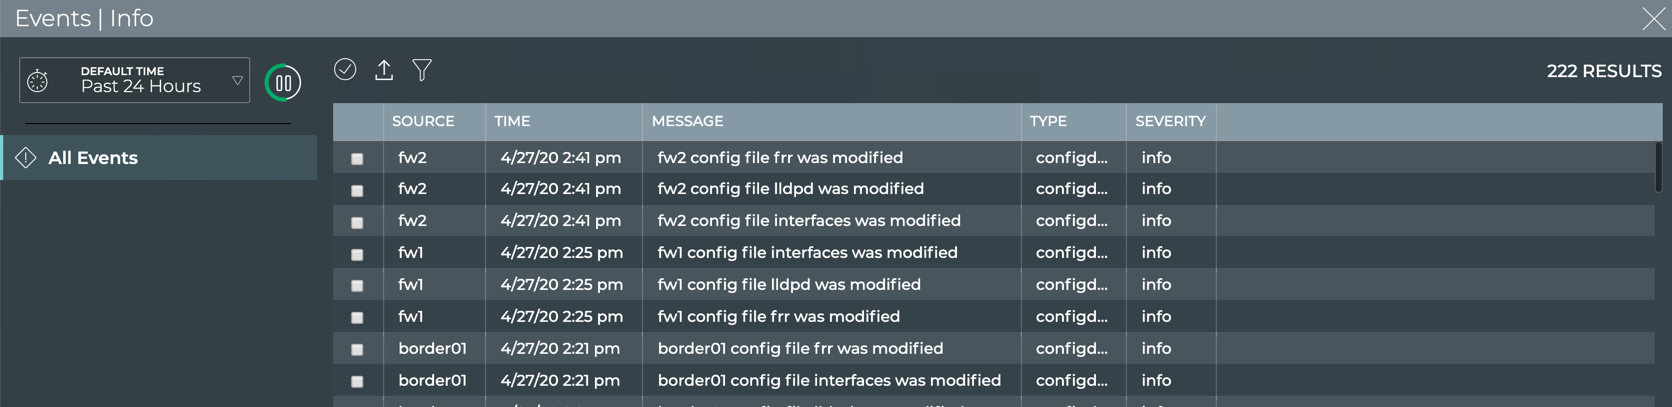
The full screen Info card provides tabs for all events.
| Item | Description |
|---|---|
| Title | Events | Info |
| Closes full screen card and returns to workbench | |
| Default Time | Range of time in which the displayed data was collected |
| Displays data refresh status. Click |
|
| Results | Number of results found for the selected tab |
| All Events | Displays all events (both alarms and info) received in the time period. By default, the requests list is sorted by the date and time that the event occurred (Time). This tab provides the following additional data about each request:
|
| Table Actions | Select, export, or filter the list. Refer to Table Settings. |
View Info Status Summary
A summary of the informational events occurring in the network can be found on the small, medium, and large Info cards. Additional details are available as you increase the size of the card.
To view the summary with the small Info card, simply open the card. This card gives you a high-level view in a condensed visual, including the number and distribution of the info events along with the alarms that have occurred during the same time period.
To view the summary with the medium Info card, simply open the card. This card gives you the same count and distribution of info and alarm events, but it also provides information about the sources of the info events and enables you to view a small slice of time using the distribution charts.
Use the chart at the top of the card to view the various sources of info events. The four or so types with the most info events are called out separately, with all others collected together into an Other category. Hover over segment of chart to view the count for each type.
To view the summary with the large Info card, open the card. The left side of the card provides the same capabilities as the medium Info card.
Compare Timing of Info and Alarm Events
While you can see the relative relationship between info and alarm events on the small Info card, the medium and large cards provide considerably more information. Open either of these to view individual line charts for the events. Generally, alarms have some corollary info events. For example, when a network service becomes unavailable, a critical alarm is often issued, and when the service becomes available again, an info event of severity warning is generated. For this reason, you might see some level of tracking between the info and alarm counts and distributions. Some other possible scenarios:
- When a critical alarm is resolved, you may see a temporary increase in info events as a result.
- When you get a burst of info events, you may see a follow-on increase in critical alarms, as the info events may have been warning you of something beginning to go wrong.
- You set logging to debug, and a large number of info events of severity debug are seen. You would not expect to see an increase in critical alarms.
View All Info Events Sorted by Time of Occurrence
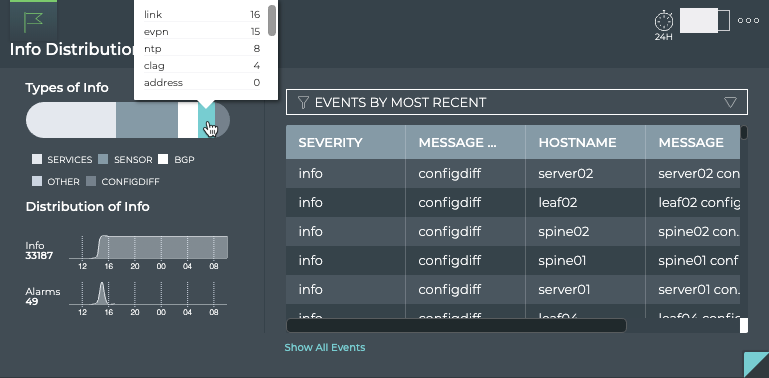
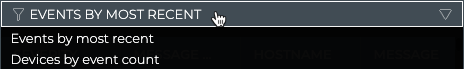
You can view all info events using the large Info card. Open the large card and confirm the Events By Most Recent option is selected in the filter above the table on the right. When this option is selected, all of the info events are listed with the most recently occurring event at the top. Scrolling down shows you the info events that have occurred at an earlier time within the selected time period for the card.
View Devices with the Most Info Events
You can filter instead for the devices that have the most info events by selecting the Devices by Event Count option from the filter above the table.
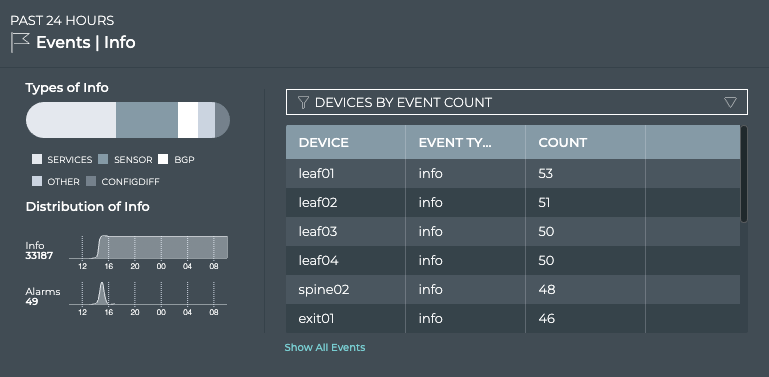
You can open the switch card for any of the listed devices by clicking on the device name.
View All Events
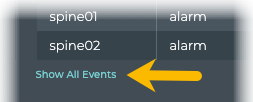
You can view all events in the network either by clicking the Show All Events link under the table on the large Info Events card, or by opening the full screen Info Events card.
OR
To return to your workbench, click ![]() in the top right corner of the card.
in the top right corner of the card.