Validate Network Protocol and Service Operations
With the NetQ UI, you can validate the operation of the network protocols and services running in your network either on demand or on a scheduled basis. There are three card workflows to perform this validation: one for creating the validation request (either on-demand or scheduled) and two validation results (one for on-demand and one for scheduled).
This release supports validation of the following network protocols and services: Agents, BGP, CLAG, EVPN, Interfaces, License, MTU, NTP, OSPF, Sensors, VLAN, and VXLAN.
For a more general understanding of how well your network is operating, refer to the Monitor Network Health topic.
Create Validation Requests
The Validation Request card workflow is used to create on-demand validation requests to evaluate the health of your network protocols and services.
Validation Request Card Workflow
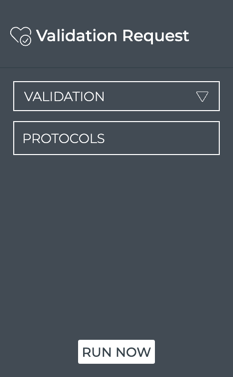
The small Validation Request card displays:

| Item | Description |
|---|---|
| Indicates a validation request | |
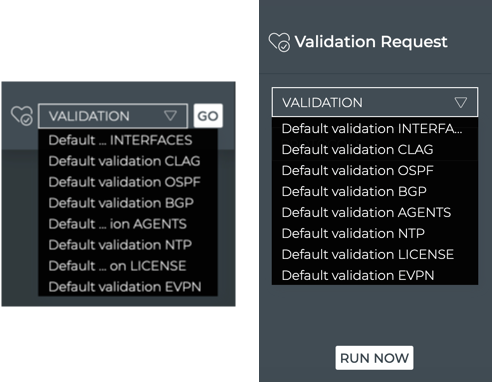
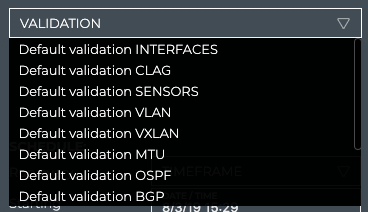
| Validation | Select a scheduled request to run that request on-demand. A default validation is provided for each supported network protocol and service, which runs a network-wide validation check. These validations run every 60 minutes, but you may run them on-demand at any time. Note: No new requests can be configured from this size card. |
| GO | Start the validation request. The corresponding On-demand Validation Result cards are opened on your workbench, one per protocol and service. |
The medium Validation Request card displays:
| Item | Description |
|---|---|
| Indicates a validation request | |
| Title | Validation Request |
| Validation | Select a scheduled request to run that request on-demand. A default validation is provided for each supported network protocol and service, which runs a network-wide validation check. These validations run every 60 minutes, but you may run them on-demand at any time. Note: No new requests can be configured from this size card. |
| Protocols | The protocols included in a selected validation request are listed here. |
| Schedule | For a selected scheduled validation, the schedule and the time of the last run are displayed. |
| Start the validation request | Run Now |
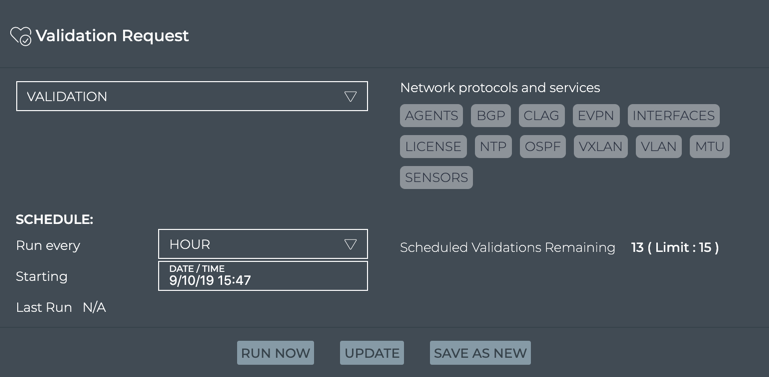
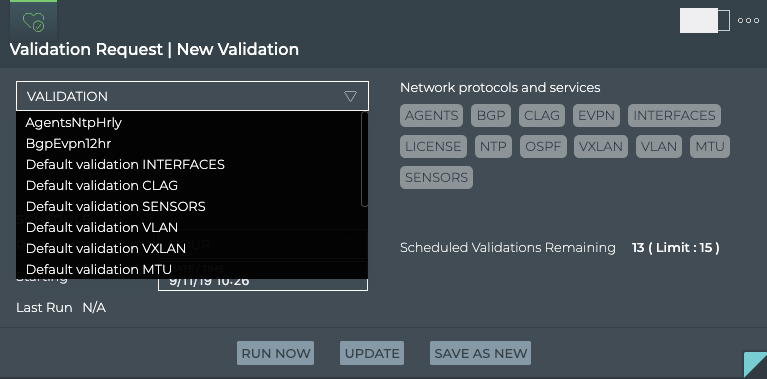
The large Validation Request card displays:
| Item | Description |
|---|---|
| Indicates a validation request | |
| Title | Validation Request |
| Validation | Depending on user intent, this field is used to:
|
| Protocols | For a selected scheduled validation, the protocols included in a validation request are listed here. For new on-demand or scheduled validations, click these to include them in the validation. |
| Schedule: | For a selected scheduled validation, the schedule and the time of the last run are displayed. For new scheduled validations, select the frequency and starting date and time.
|
| Scheduled Validations | Count of scheduled validations that are currently scheduled compared to the maximum of 15 allowed |
| Run Now | Start the validation request |
| Update | When changes are made to a selected validation request, Update becomes available so that you can save your changes.
Be aware, that if you update a previously saved validation request, the historical data collected will no longer match the data results of future runs of the request. If your intention is to leave this request unchanged and create a new request, click Save As New instead. |
| Save As New | When changes are made to a previously saved validation request, Save As New becomes available so that you can save the modified request as a new request. |
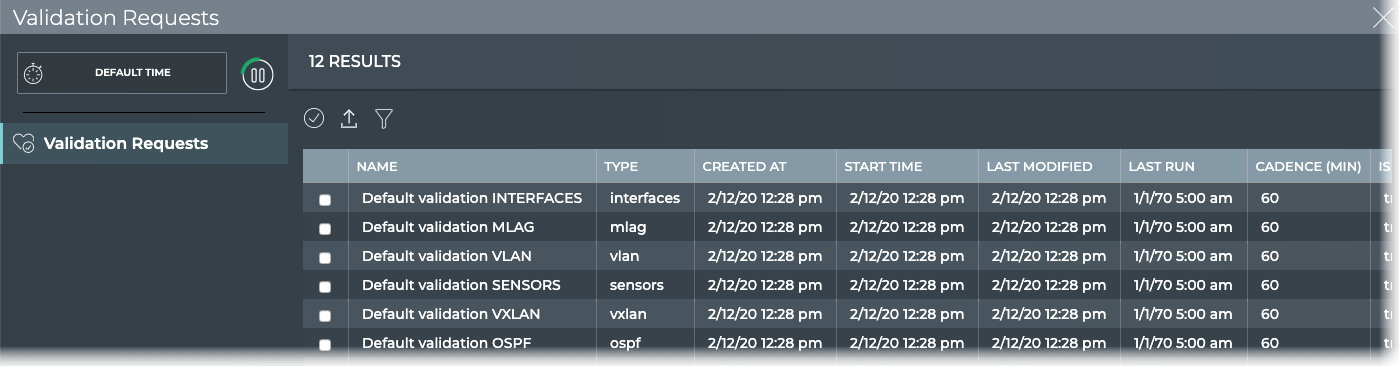
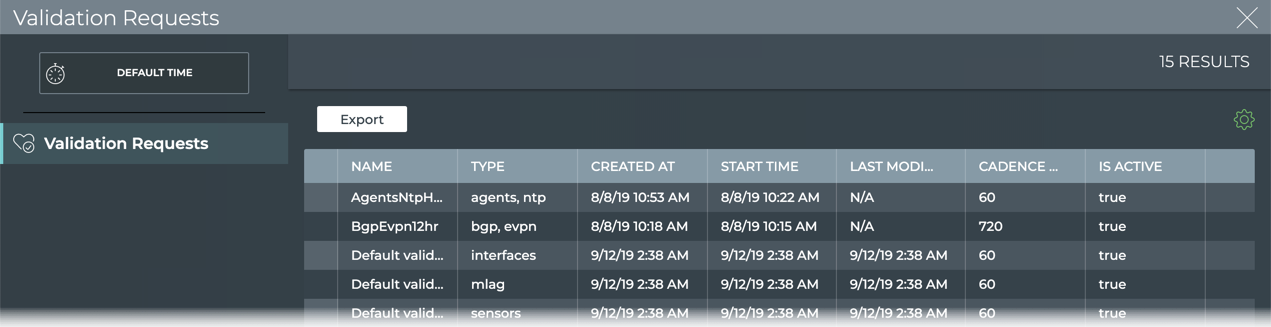
The full screen Validation Request card displays all scheduled validation requests.
| Item | Description |
|---|---|
| Title | Validation Request |
| Closes full screen card and returns to workbench | |
| Default Time | No time period is displayed for this card as each validation request has its own time relationship. |
| Displays data refresh status. Click |
|
| Results | Number of results found for the selected tab |
| Validation Requests | Displays all scheduled validation requests. By default, the requests list is sorted by the date and time that it was originally created (Created At). This tab provides the following additional data about each request:
|
| Table Actions | Select, export, or filter the list. Refer to Table Settings. |
Create On-demand and Scheduled Validation Requests
There are several types of validation requests that a user can make. Each has a slightly different flow through the Validation Request card, and is therefore described separately. The types are based on the intent of the request:
- Run an Existing Scheduled Validation Request On Demand
- Create a New On-demand Validation Request
- Create a New Scheduled Validation Request
- Modify an Existing Scheduled Validation Request
Run an Existing Scheduled Validation Request On Demand
You may find that although you have a validation scheduled to run at a later time, you would like to run it now.
To run a scheduled validation now:
-
Open either the small, medium, or large Validation Request card.
-
Select the validation from the Validation dropdown list.
-
Click Go or Run Now.
The associated Validation Result card is opened on your workbench. Refer to View On-demand Validation Results.
Create a New On-demand Validation Request
When you want to validate the operation of one or more network protocols and services right now, you can create and run an on-demand validation request using the large Validation Request card.
To create and run a request for a single protocol or service:
-
Open the small, medium or large Validation Request card.
-
Select the validation from the Validation dropdown list.
-
Click Go or Run Now.
The associated Validation Result card is opened on your workbench. Refer to View On-demand Validation Results.
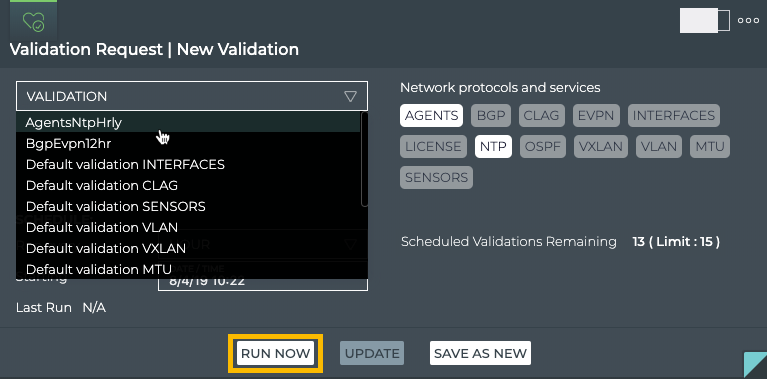
To create and run a request for more than one protocol and/or service:
-
Open the large Validation Request card.
-
Click the names of the protocols and services you want to validate. We selected BGP and EVPN in this example.
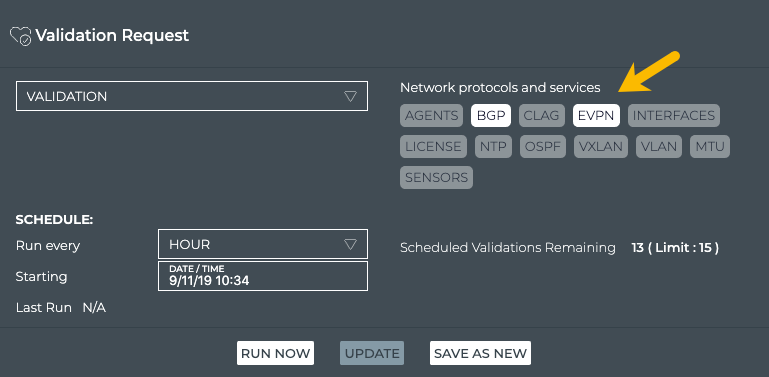
-
Click Run Now to start the validation.
The associated on-demand validation result cards (one per protocol or service selected) are opened on your current workbench. Refer to View On-demand Validation Results.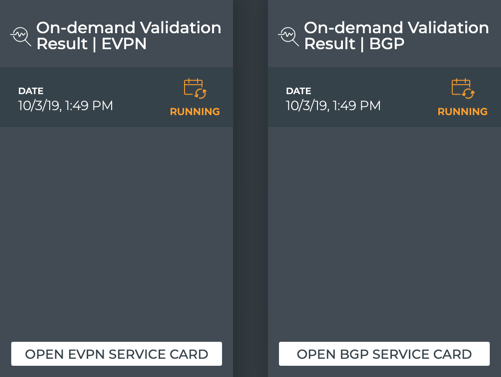
Create a New Scheduled Validation Request
When you want to see validation results on a regular basis, it is useful to configure a scheduled validation request to avoid re-creating the request each time.
To create and run a new scheduled validation:
-
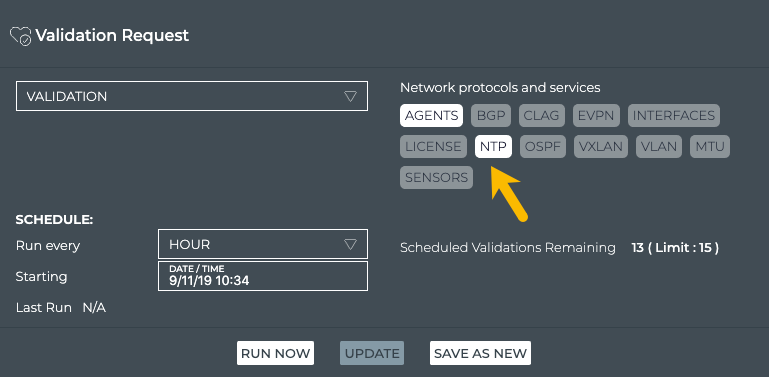
Open the large Validation Request card.
-
Select the protocols and/or services you want to include in the validation. In this example we have chosen the Agents and NTP services.
-
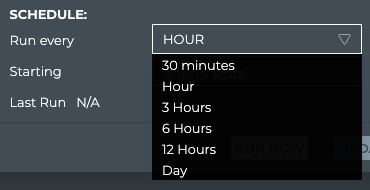
Enter the schedule frequency (30 min, 1 hour, 3 hours, 6 hours, 12 hours, or 1 day) by selecting it from the Run every list. Default is hourly.
-
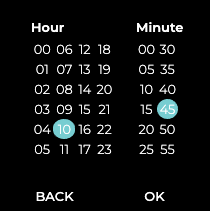
Select the time to start the validation runs, by clicking in the Starting field. Select a day and click Next, then select the starting time and click OK.

-
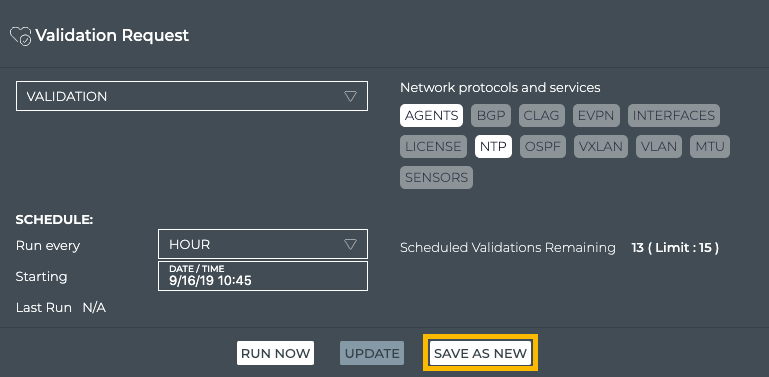
Verify the selections were made correctly.
-
Click Save As New.
-
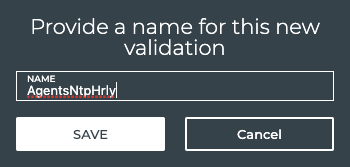
Enter a name for the validation.
Spaces and special characters are not allowed in validation request names.
-
Click Save.
The validation can now be selected from the Validation listing (on the small, medium or large size card) and run immediately using Run Now, or you can wait for it to run the first time according to the schedule you specified. Refer to View Scheduled Validation Results. Note that the number of scheduled validations is now two (2).
Modify an Existing Scheduled Validation Request
At some point you might want to change the schedule or validation types that are specified in a scheduled validation request.
When you update a scheduled request, the results for all future runs of the validation will be different than the results of previous runs of the validation.
To modify a scheduled validation:
- Open the large Validation Request card.
- Select the validation from the Validation dropdown list.
- Edit the schedule or validation types.
- Click Update.
The validation can now be selected from the Validation listing (on the small, medium or large size card) and run immediately using Run Now, or you can wait for it to run the first time according to the schedule you specified. Refer to View Scheduled Validation Results.
View On-demand Validation Results
The On-demand Validation Result card workflow enables you to view the results of on-demand validation requests. When a request has started processing, the associated medium Validation Result card is displayed on your workbench. When multiple network protocols or services are included in a validation, a validation result card is opened for each protocol and service.
On-Demand Validation Result Card Workflow
The small Validation Result card displays:
| Item | Description |
|---|---|
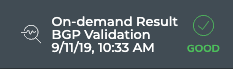
| Indicates an on-demand validation result | |
| Title | On-demand Result <Network Protocol or Service Name> Validation |
| Timestamp | Date and time the validation was completed |
Status of the validation job, where:
|
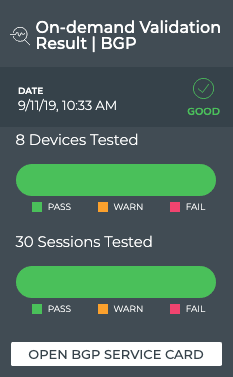
The medium Validation Result card displays:
| Item | Description |
|---|---|
| Indicates an on-demand validation result | |
| Title | On-demand Validation Result | <Network Protocol or Service Name> |
| Timestamp | Date and time the validation was completed |
Status of the validation job, where:
|
|
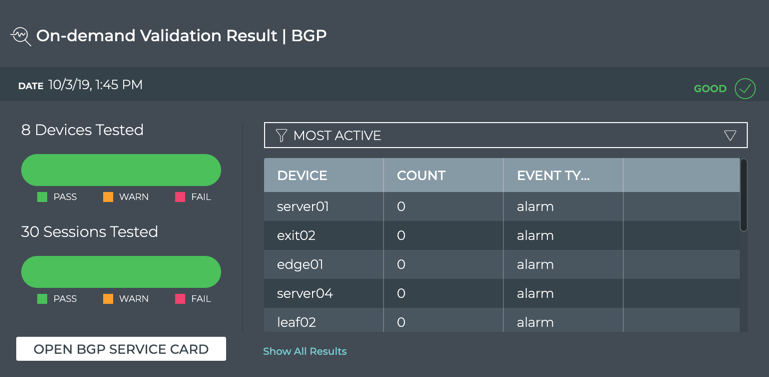
| Devices Tested | Chart with the total number of devices included in the validation and the distribution of the results.
Hover over chart to view the number of devices and the percentage of all tested devices for each result category. |
| Sessions Tested | For BGP, chart with total number of BGP sessions included in the validation and the distribution of the overall results. For EVPN, chart with total number of BGP sessions included in the validation and the distribution of the overall results. For Interfaces, chart with total number of ports included in the validation and the distribution of the overall results. In each of these charts:
Hover over chart to view the number of devices, sessions, or ports and the percentage of all tested devices, sessions, or ports for each result category. This chart does not apply to other Network Protocols and Services, and thus is not displayed for those cards. |
| Open <Service> Card | Click to open the corresponding medium Network Services card, where available. Refer to Monitor Network Performance for details about these cards and workflows. |
The large Validation Result card contains two tabs.
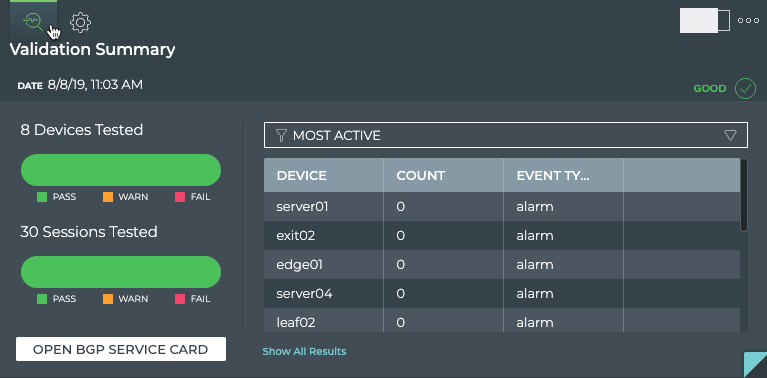
The Summary tab displays:
| Item | Description |
|---|---|
| Indicates an on-demand validation result | |
| Title | On-demand Validation Result | Summary | <Network Protocol or Service Name> |
| Date | Day and time when the validation completed |
Status of the validation job, where:
|
|
| Devices Tested | Chart with the total number of devices included in the validation and the distribution of the results.
Hover over chart to view the number of devices and the percentage of all tested devices for each result category. |
| Sessions Tested | For BGP, chart with total number of BGP sessions included in the validation and the distribution of the overall results. For EVPN, chart with total number of BGP sessions included in the validation and the distribution of the overall results. For Interfaces, chart with total number of ports included in the validation and the distribution of the overall results. For OSPF, chart with total number of OSPF sessions included in the validation and the distribution of the overall results. In each of these charts:
Hover over chart to view the number of devices, sessions, or ports and the percentage of all tested devices, sessions, or ports for each result category. This chart does not apply to other Network Protocols and Services, and thus is not displayed for those cards. |
| Open <Service> Card | Click to open the corresponding medium Network Services card, when available. Refer to Monitor Network Performance for details about these cards and workflows. |
| Table/Filter options | When the Most Active filter option is selected, the table displays switches and hosts running the given service or protocol in decreasing order of alarm counts-devices with the largest number of warnings and failures are listed first. When the Most Recent filter option is selected, the table displays switches and hosts running the given service or protocol sorted by timestamp, with the device with the most recent warning or failure listed first. The table provides the following additional information:
|
| Show All Results | Click to open the full screen card with all on-demand validation results sorted by timestamp. |
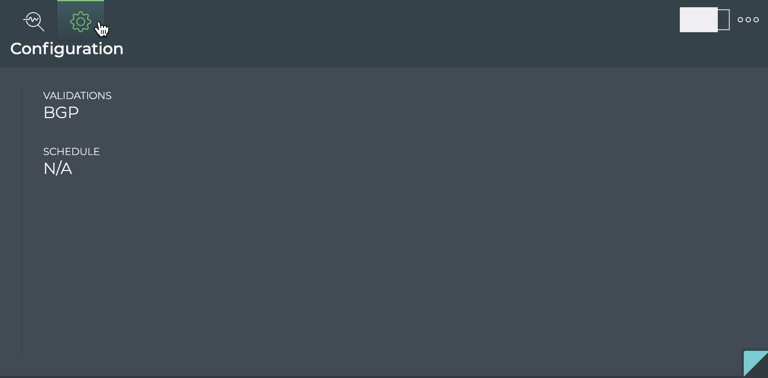
The Configuration tab displays:
| Item | Description |
|---|---|
| Indicates an on-demand validation request configuration | |
| Title | On-demand Validation Result | Configuration | <Network Protocol or Service Name> |
| Validations | List of network protocols or services included in the request that produced these results |
| Schedule | Not relevant to on-demand validation results. Value is always N/A. |
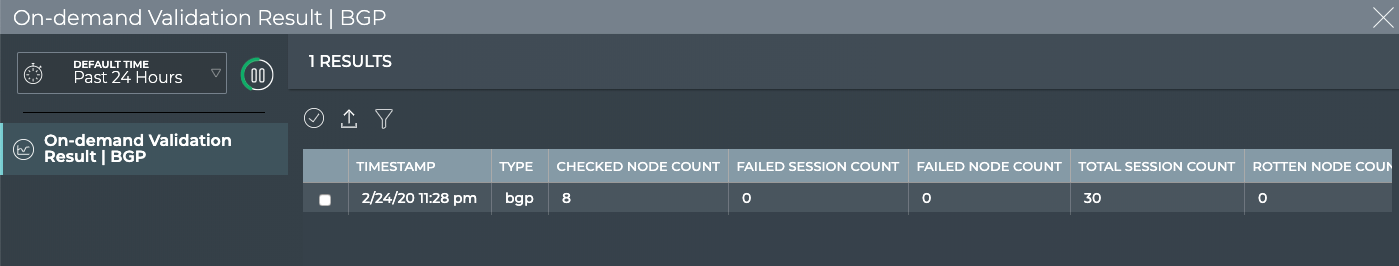
The full screen Validation Result card provides a tab for all on-demand validation results.
| Item | Description |
|---|---|
| Title | Validation Results | On-demand |
| Closes full screen card and returns to workbench | |
| Time period | Range of time in which the displayed data was collected; applies to all card sizes; select an alternate time period by clicking |
| Displays data refresh status. Click |
|
| Results | Number of results found for the selected tab |
| On-demand Validation Result | <network protocol or service> | Displays all unscheduled validation results. By default, the results list is sorted by Timestamp. This tab provides the following additional data about each result:
|
| Table Actions | Select, export, or filter the list. Refer to Table Settings. |
View On-demand Validation Results
Once an on-demand validation request has completed, the results are available in the corresponding Validation Result card.
It may take a few minutes for all results to be presented if the load on the NetQ Platform is heavy at the time of the run.
To view the results:
-
Locate the medium on-demand Validation Result card on your workbench for the protocol or service that was run.
You can identify it by the on-demand result icon,
 , protocol or service name, and the date and time that it was run.
Note: You may have more than one card open for a given protocol or service, so be sure to use the date and time on the card to ensure you are viewing the correct card.
-
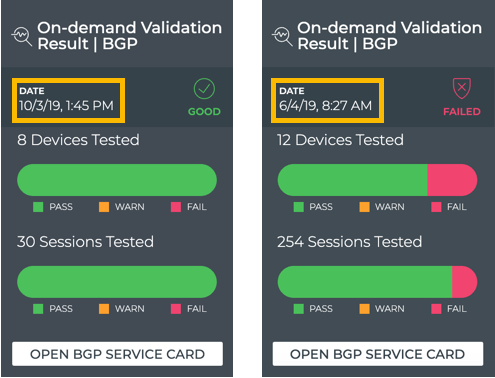
Note the total number and distribution of results for the tested devices and sessions (when appropriate). Are there many failures?
-
Hover over the charts to view the total number of warnings or failures and what percentage of the total results that represents for both devices and sessions.
-
Switch to the large on-demand Validation Result card.
-
If there are a large number of device warnings or failures, view the devices with the most issues in the table on the right. By default, this table displays the Most Active devices.
-
To view the most recent issues, select Most Recent from the filter above the table.
-
If there are a large number of devices or sessions with warnings or failures, the protocol or service may be experiencing issues. View the health of the protocol or service as a whole by clicking Open <network service> Card when available.
-
To view all data available for all on-demand validation results for a given protocol, switch to the full screen card.
-
Double-click in a given result row to open details about the validation.
From this view you can:
-
See a summary of the validation results by clicking
 in the banner under the title. Toggle the arrow to close the summary.
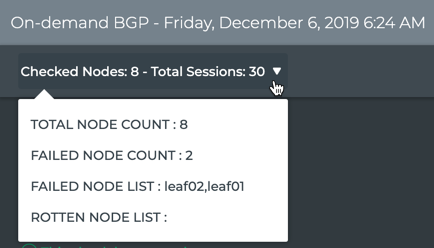
-
See detailed results of each test run to validate the protocol or service. When errors or warnings are present, the nodes and relevant detail is provided.
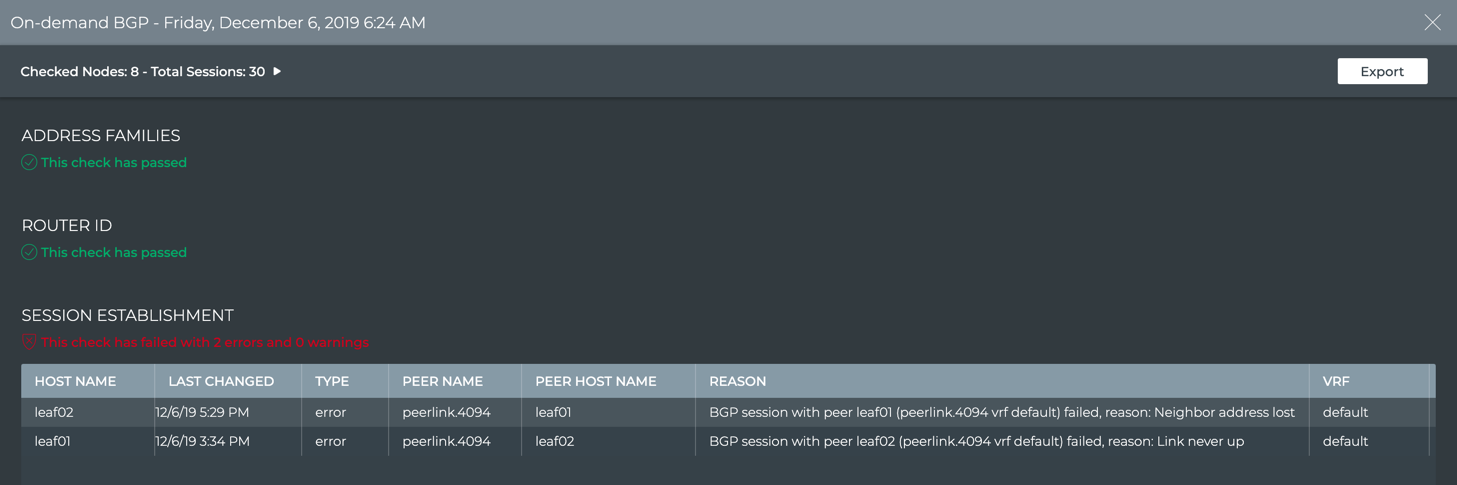
-
Export the data by clicking Export.
-
Return to the validation jobs list by clicking
 .
.
You may find that comparing various results gives you a clue as to why certain devices are experiencing more warnings or failures. For example, more failures occurred between certain times or on a particular device.
-
View Scheduled Validation Results
The Scheduled Validation Result card workflow enables you to view the results of scheduled validation requests. When a request has completed processing, you can access the Validation Result card from the full screen Validation Request card. Each protocol and service has its own validation result card, but the content is similar on each.
Scheduled Validation Result Card Workflow Summary
The small Scheduled Validation Result card displays:

| Item | Description |
|---|---|
| Indicates a scheduled validation result | |
| Title | Scheduled Result <Network Protocol or Service Name> Validation |
| Results | Summary of validation results:
|
Status of the validation job, where:
|
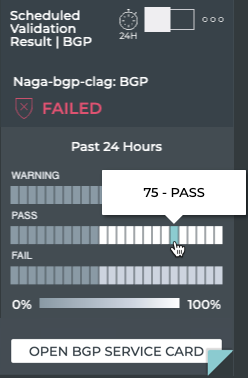
The medium Scheduled Validation Result card displays:
| Item | Description |
|---|---|
| Time period | Range of time in which the displayed data was collected; applies to all card sizes |
| Indicates a scheduled validation result | |
| Title | Scheduled Validation Result | <Network Protocol or Service Name> |
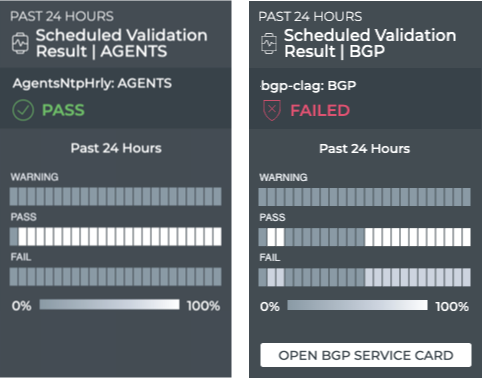
| Summary | Summary of validation results:
|
| Chart | Validation results, where:
|
| Open <Service> Card | Click to open the corresponding medium Network Services card, when available. Refer to Monitor Network Performance for details about these cards and workflows. |
The large Scheduled Validation Result card contains two tabs.
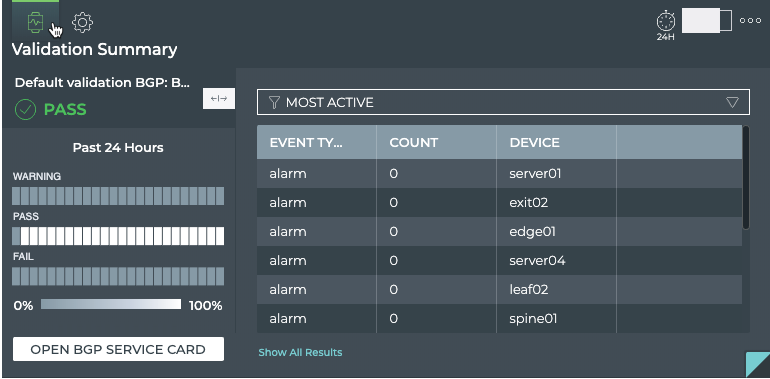
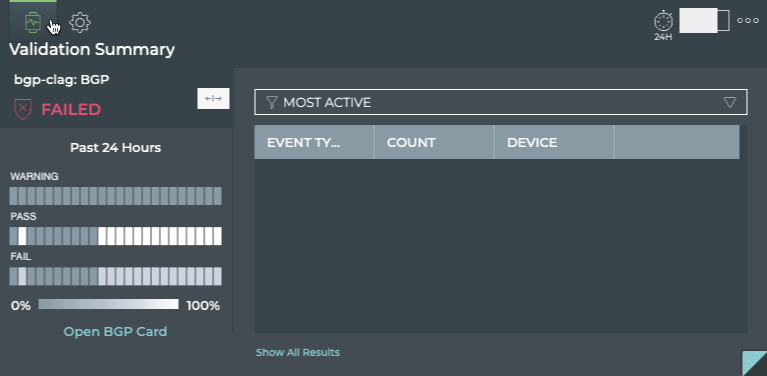
The Summary tab displays:
| Item | Description |
|---|---|
| Indicates a scheduled validation result | |
| Title | Validation Summary (Scheduled Validation Result | <Network Protocol or Service Name>) |
| Summary | Summary of validation results:
|
| Chart | Validation results, where:
|
| Open <Service> Card | Click to open the corresponding medium Network Services card, when available. Refer to Monitor Network Performance for details about these cards and workflows. |
| Table/Filter options | When the Most Active filter option is selected, the table displays switches and hosts running the given service or protocol in decreasing order of alarm counts-devices with the largest number of warnings and failures are listed first. When the Most Recent filter option is selected, the table displays switches and hosts running the given service or protocol sorted by timestamp, with the device with the most recent warning or failure listed first. The table provides the following additional information:
|
| Show All Results | Click to open the full screen card with all scheduled validation results sorted by timestamp. |
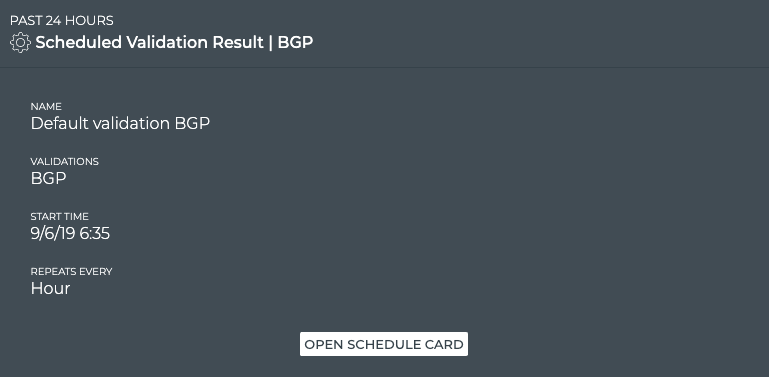
The Configuration tab displays:
| Item | Description |
|---|---|
| Indicates a scheduled validation configuration | |
| Title | Configuration (Scheduled Validation Result | <Network Protocol or Service Name>) |
| Name | User-defined name for this scheduled validation |
| Validations | List of validations included in the validation request that created this result |
| Schedule | User-defined schedule for the validation request that created this result |
| Open Schedule Card | Opens the large Validation Request card for editing this configuration |
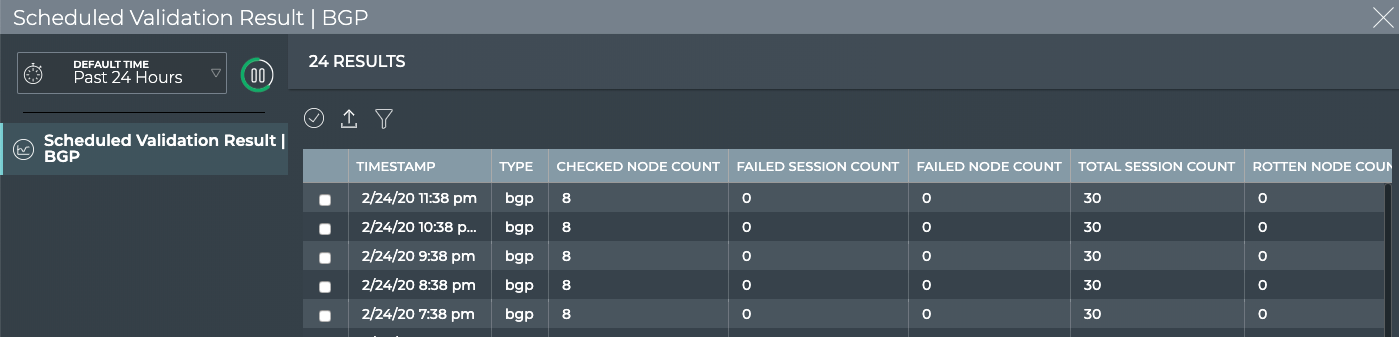
The full screen Scheduled Validation Result card provides tabs for all scheduled validation results for the service.
| Item | Description |
|---|---|
| Title | Scheduled Validation Results | <Network Protocol or Service> |
| Closes full screen card and returns to workbench | |
| Time period | Range of time in which the displayed data was collected; applies to all card sizes; select an alternate time period by clicking |
| Displays data refresh status. Click |
|
| Results | Number of results found for the selected tab |
| Scheduled Validation Result | <network protocol or service> | Displays all unscheduled validation results. By default, the results list is sorted by timestamp. This tab provides the following additional data about each result:
|
| Table Actions | Select, export, or filter the list. Refer to Table Settings. |
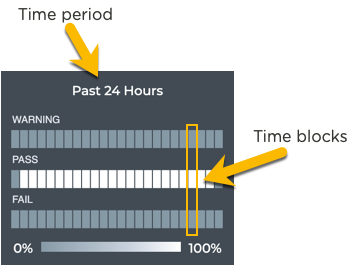
Granularity of Data Shown Based on Time Period
On the medium and large Validation Result cards, the status of the runs is represented in heat maps stacked vertically; one for passing runs, one for runs with warnings, and one for runs with failures. Depending on the time period of data on the card, the number of smaller time blocks used to indicate the status varies. A vertical stack of time blocks, one from each map, includes the results from all checks during that time. The results are shown by how saturated the color is for each block. If all validations during that time period pass, then the middle block is 100% saturated (white) and the warning and failure blocks are zero % saturated (gray). As warnings and errors increase in saturation, the passing block is proportionally reduced in saturation. An example heat map for a time period of 24 hours is shown here with the most common time periods in the table showing the resulting time blocks and regions.
| Time Period | Number of Runs | Number Time Blocks | Amount of Time in Each Block |
|---|---|---|---|
| 6 hours | 18 | 6 | 1 hour |
| 12 hours | 36 | 12 | 1 hour |
| 24 hours | 72 | 24 | 1 hour |
| 1 week | 504 | 7 | 1 day |
| 1 month | 2,086 | 30 | 1 day |
| 1 quarter | 7,000 | 13 | 1 week |
View Scheduled Validation Results
Once a scheduled validation request has completed, the results are available in the corresponding Validation Result card.
To view the results:
-
Open the full size Validation Request card to view all scheduled validations.
-
Select the validation results you want to view by clicking in the first column of the result and clicking the check box.
-
On the Edit Menu that appears at the bottom of the window, click
 (Open Cards). This opens the medium Scheduled Validation Results card(s) for the selected items.
-
Note the distribution of results. Are there many failures? Are they concentrated together in time? Has the protocol or service recovered after the failures?
-
Hover over the heat maps to view the status numbers and what percentage of the total results that represents for a given region. The tooltip also shows the number of devices included in the validation and the number with warnings and/or failures. This is useful when you see the failures occurring on a small set of devices, as it might point to an issue with the devices rather than the network service.
-
Optionally, click Open <network service> Card link to open the medium individual Network Services card. Your current card is not closed.
-
Switch to the large Scheduled Validation card.
-
Click
 to expand the chart.
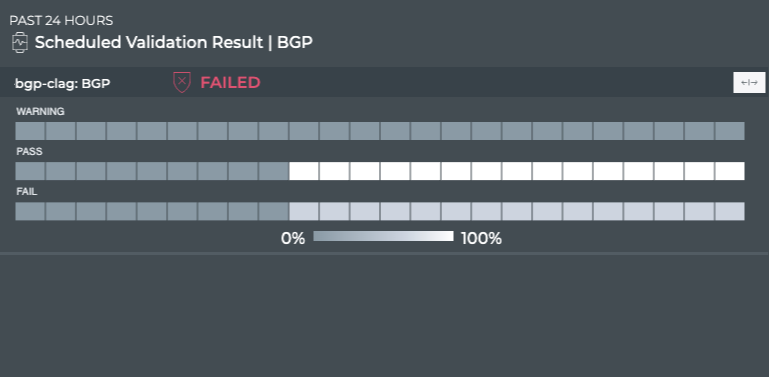
-
Collapse the heat map by clicking
.
-
If there are a large number of warnings or failures, view the devices with the most issues by clicking Most Active in the filter above the table. This might help narrow the failures down to a particular device or small set of devices that you can investigate further.
-
Select the Most Recent filter above the table to see the events that have occurred in the near past at the top of the list.
-
Optionally, view the health of the protocol or service as a whole by clicking Open <network service> Card (when available).
-
You can view the configuration of the request that produced the results shown on this card workflow, by hovering over the card and clicking
 . If you want to change the configuration, click Edit Config to open the large Validation Request card, pre-populated with the current configuration. Follow the instructions in Modify an Existing Scheduled Validation Request to make your changes.
 -
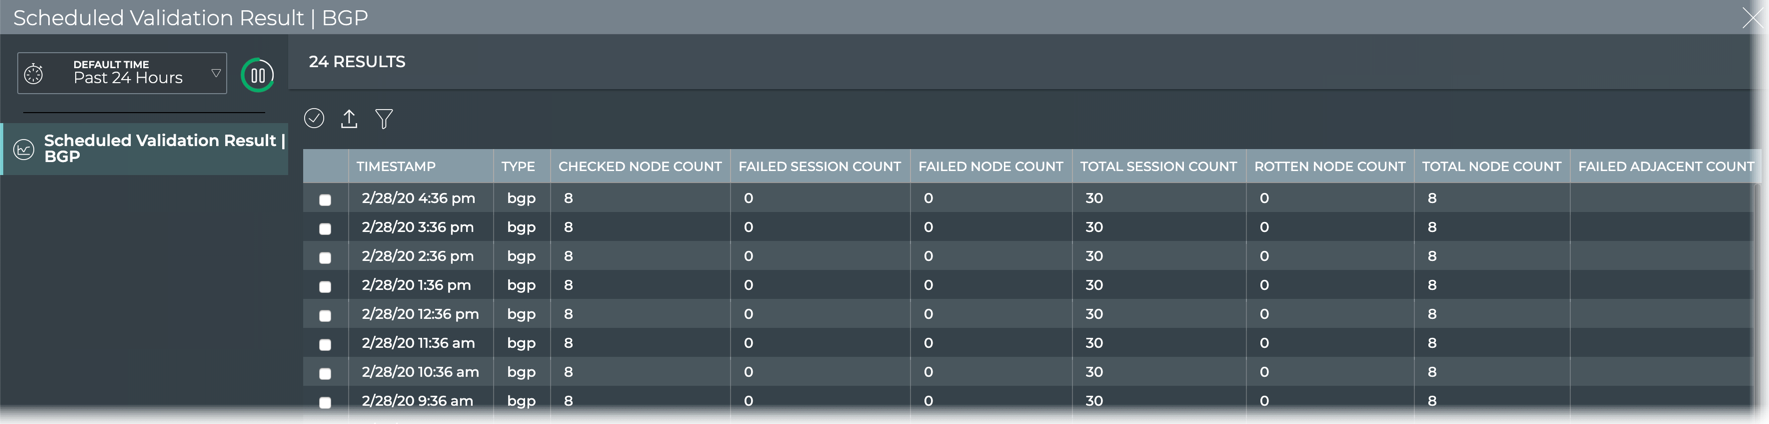
To view all data available for all scheduled validation results for the given protocol or service, click Show All Results or switch to the full screen card.
-
Look for changes and patterns in the results. Scroll to the right. Are there more failed sessions or nodes during one or more validations?
-
Double-click in a given result row to open details about the validation.
From this view you can:
-
See a summary of the validation results by clicking
in the banner under the title. Toggle the arrow to close the summary.
-
See detailed results of each test run to validate the protocol or service. When errors or warnings are present, the nodes and relevant detail is provided.
-
Export the data by clicking Export.
-
Return to the validation jobs list by clicking
.
You may find that comparing various results gives you a clue as to why certain devices are experiencing more warnings or failures. For example, more failures occurred between certain times or on a particular device.
-