Monitor the EVPN Service
The Cumulus NetQ UI enables operators to view the health of the EVPN service on a network-wide and a per session basis, giving greater insight into all aspects of the service. This is accomplished through two card workflows, one for the service and one for the session. They are described separately here.
Monitor the EVPN Service (All Sessions)
With NetQ, you can monitor the number of nodes running the EVPN service, view switches with the sessions, total number of VNIs, and alarms triggered by the EVPN service. For an overview and how to configure EVPN in your data center network, refer to Ethernet Virtual Private Network-EVPN.
EVPN Service Card Workflow Summary
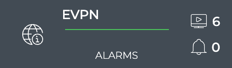
The small EVPN Service card displays:
| Item | Description |
|---|---|
| Indicates data is for all sessions of a Network Service or Protocol | |
| Title | EVPN: All EVPN Sessions, or the EVPN Service |
| Total number of switches and hosts with the EVPN service enabled during the designated time period | |
| Total number of EVPN-related alarms received during the designated time period | |
| Chart | Distribution of EVPN-related alarms received during the designated time period |
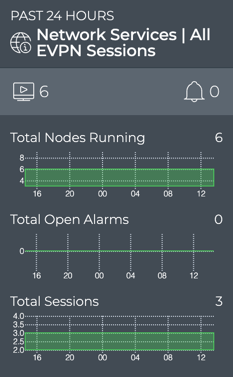
The medium EVPN Service card displays:
| Item | Description |
|---|---|
| Time period | Range of time in which the displayed data was collected; applies to all card sizes |
| Indicates data is for all sessions of a Network Service or Protocol | |
| Title | Network Services | All EVPN Sessions |
| Total number of switches and hosts with the EVPN service enabled during the designated time period | |
| Total number of EVPN-related alarms received during the designated time period | |
| Total Nodes Running chart | Distribution of switches and hosts with the EVPN service enabled during the designated time period, and a total number of nodes running the service currently. Note: The node count here may be different than the count in the summary bar. For example, the number of nodes running EVPN last week or last month might be more or less than the number of nodes running EVPN currently. |
| Total Open Alarms chart | Distribution of EVPN-related alarms received during the designated time period, and the total number of current EVPN-related alarms in the network. Note: The alarm count here may be different than the count in the summary bar. For example, the number of new alarms received in this time period does not take into account alarms that have already been received and are still active. You might have no new alarms, but still have a total number of alarms present on the network of 10. |
| Total Sessions chart | Distribution of EVPN sessions during the designated time period, and the total number of sessions running on the network currently. |
The large EVPN service card contains two tabs.
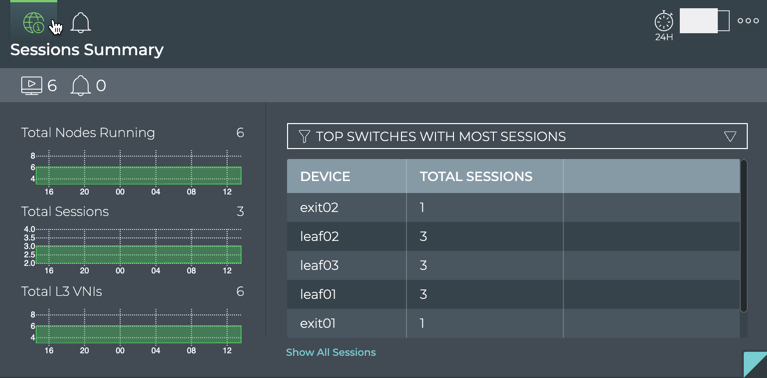
The Sessions Summary tab which displays:
| Item | Description |
|---|---|
| Time period | Range of time in which the displayed data was collected; applies to all card sizes |
| Indicates data is for all sessions of a Network Service or Protocol | |
| Title | Sessions Summary (visible when you hover over card) |
| Total number of switches and hosts with the EVPN service enabled during the designated time period | |
| Total number of EVPN-related alarms received during the designated time period | |
| Total Nodes Running chart | Distribution of switches and hosts with the EVPN service enabled during the designated time period, and a total number of nodes running the service currently. Note: The node count here may be different than the count in the summary bar. For example, the number of nodes running EVPN last week or last month might be more or less than the number of nodes running EVPN currently. |
| Total Sessions chart | Distribution of EVPN sessions during the designated time period, and the total number of sessions running on the network currently. |
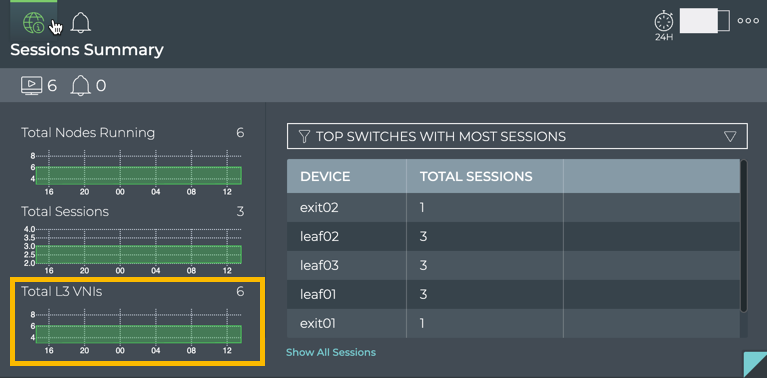
| Total L3 VNIs chart | Distribution of layer 3 VXLAN Network Identifiers during this time period, and the total number of VNIs in the network currently. |
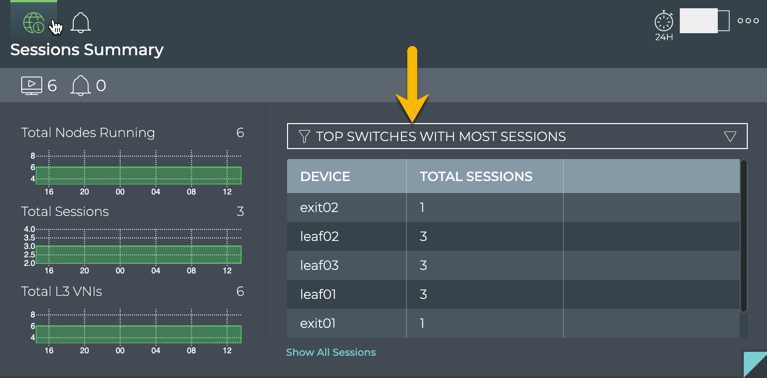
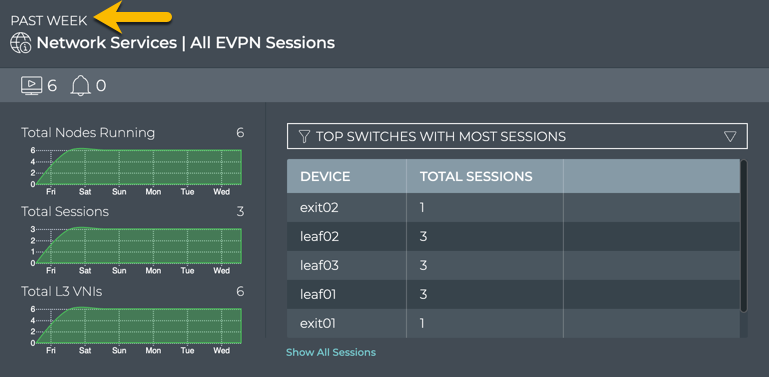
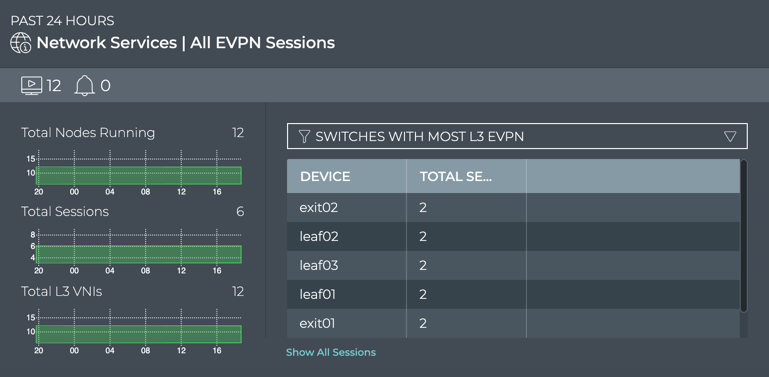
| Table/Filter options | When the Top Switches with Most Sessions filter is selected, the table displays devices running EVPN sessions in decreasing order of session count-devices with the largest number of sessions are listed first. When the Switches with Most L2 EVPN filter is selected, the table displays devices running layer 2 EVPN sessions in decreasing order of session count-devices with the largest number of sessions are listed first. When the Switches with Most L3 EVPN filter is selected, the table displays devices running layer 3 EVPN sessions in decreasing order of session count-devices with the largest number of sessions are listed first. |
| Show All Sessions | Link to view data for all EVPN sessions network-wide in the full screen card |
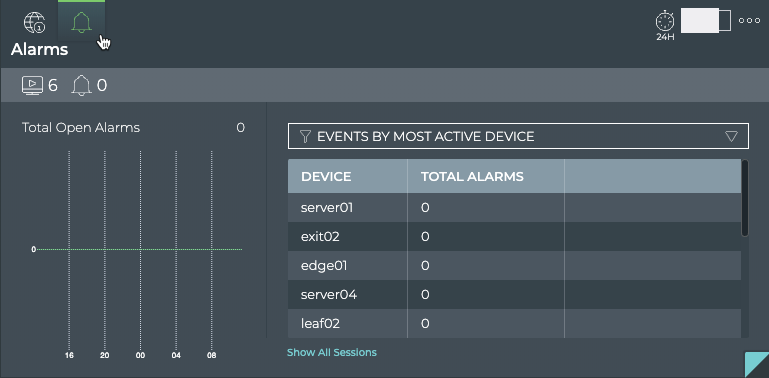
The Alarms tab which displays:
| Item | Description |
|---|---|
| Time period | Range of time in which the displayed data was collected; applies to all card sizes |
| Indicates data is for all alarms for all sessions of a Network Service or Protocol | |
| Title | Alarms (visible when you hover over card) |
| Total number of switches and hosts with the EVPN service enabled during the designated time period | |
| Total number of EVPN-related alarms received during the designated time period | |
| Total Alarms chart | Distribution of EVPN-related alarms received during the designated time period, and the total number of current BGP-related alarms in the network. Note: The alarm count here may be different than the count in the summary bar. For example, the number of new alarms received in this time period does not take into account alarms that have already been received and are still active. You might have no new alarms, but still have a total number of alarms present on the network of 10. |
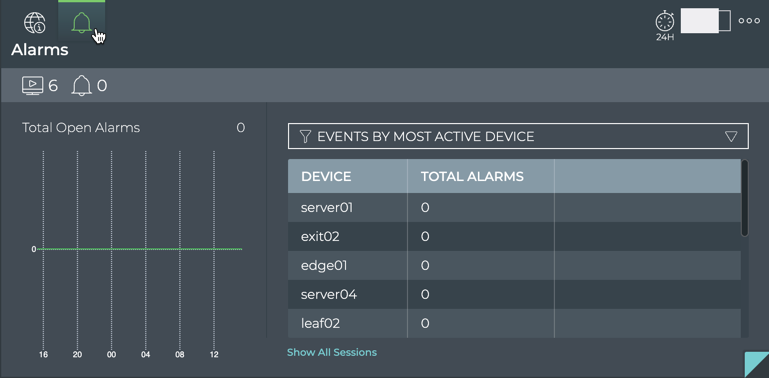
| Table/Filter options | When the Events by Most Active Device filter is selected, the table displays devices running EVPN sessions in decreasing order of alarm count-devices with the largest number of alarms are listed first |
| Show All Sessions | Link to view data for all EVPN sessions in the full screen card |
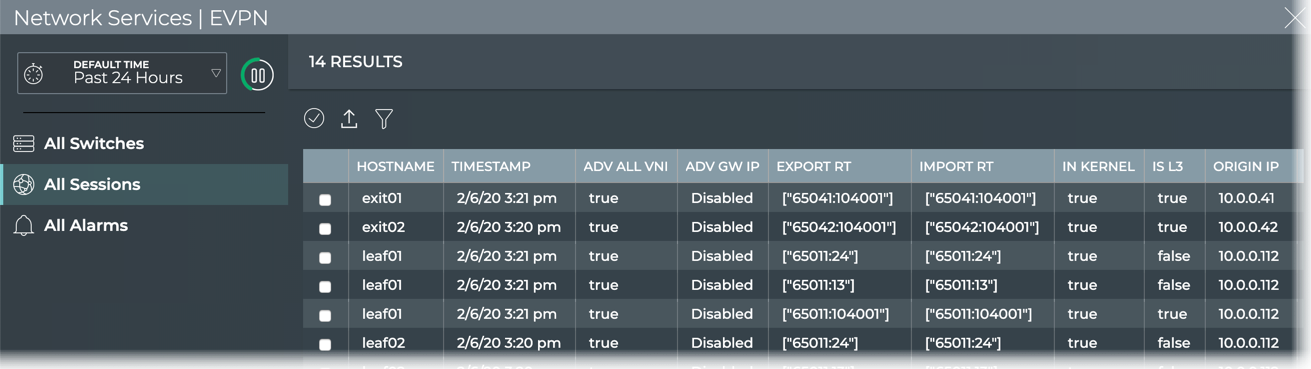
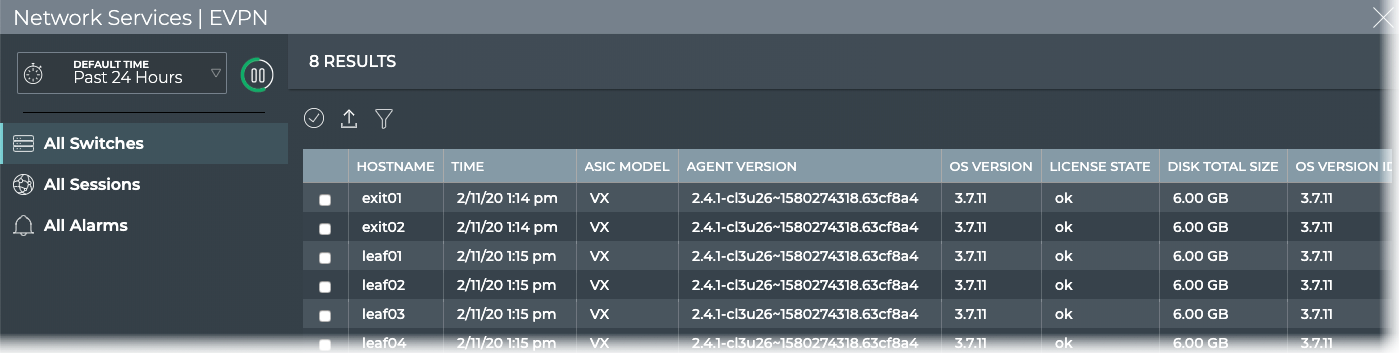
The full screen EVPN Service card provides tabs for all switches, all sessions, all alarms.
| Item | Description |
|---|---|
| Title | Network Services | EVPN |
| Closes full screen card and returns to workbench | |
| Time period | Range of time in which the displayed data was collected; applies to all card sizes; select an alternate time period by clicking |
| Displays data refresh status. Click |
|
| Results | Number of results found for the selected tab |
| All Switches tab | Displays all switches and hosts running the EVPN service. By default, the device list is sorted by hostname. This tab provides the following additional data about each device:
|
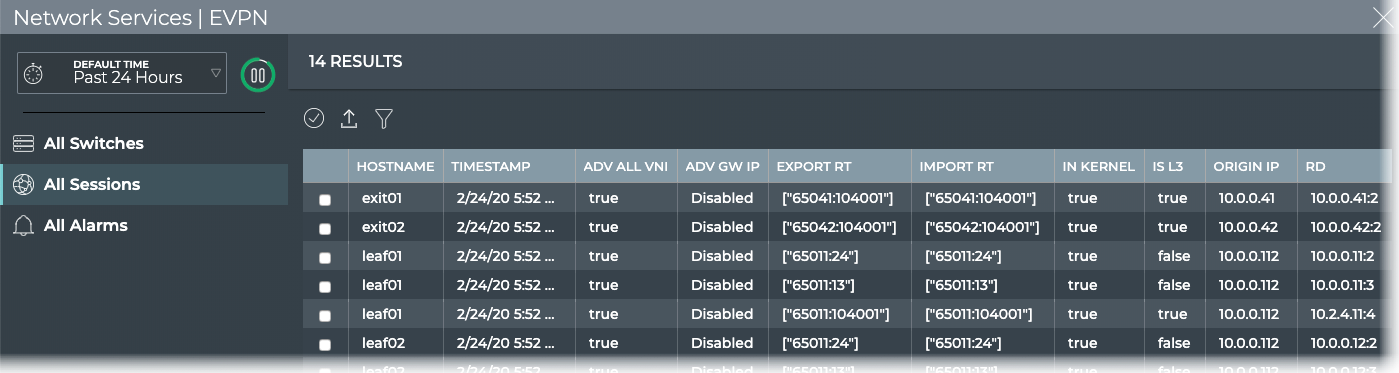
| All Sessions tab | Displays all EVPN sessions network-wide. By default, the session list is sorted by hostname. This tab provides the following additional data about each session:
|
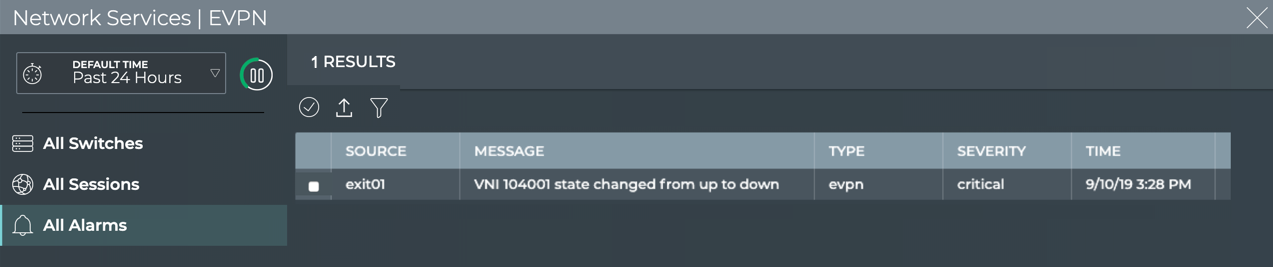
| All Alarms tab | Displays all EVPN events network-wide. By default, the event list is sorted by time, with the most recent events listed first. The tab provides the following additional data about each event:
|
| Table Actions | Select, export, or filter the list. Refer to Table Settings. |
View Service Status Summary
A summary of the EVPN service is available from the Network Services card workflow, including the number of nodes running the service, the number of EVPN-related alarms, and a distribution of those alarms.
To view the summary, open the small EVPN Network Service card.
For more detail, select a different size EVPN Network Service card.
View the Distribution of Sessions and Alarms
It is useful to know the number of network nodes running the EVPN protocol over a period of time, as it gives you insight into the amount of traffic associated with and breadth of use of the protocol. It is also useful to compare the number of nodes running EVPN with the alarms present at the same time to determine if there is any correlation between the issues and the ability to establish an EVPN session.
To view these distributions, open the medium EVPN Service card.
If a visual correlation is apparent, you can dig a little deeper with the large EVPN Service card tabs.
View the Distribution of Layer 3 VNIs
It is useful to know the number of layer 3 VNIs, as it gives you insight into the complexity of the VXLAN.
To view this distribution, open the large EVPN Service card and view the bottom chart on the left.
View Devices with the Most EVPN Sessions
You can view the load from EVPN on your switches and hosts using the large EVPN Service card. This data enables you to see which switches are handling the most EVPN traffic currently, validate that is what is expected based on your network design, and compare that with data from an earlier time to look for any differences.
To view switches and hosts with the most EVPN sessions:
-
Open the large EVPN Service card.
-
Select Top Switches with Most Sessions from the filter above the table.
The table content is sorted by this characteristic, listing nodes running the most EVPN sessions at the top. Scroll down to view those with the fewest sessions.
To compare this data with the same data at a previous time:
-
Open another large EVPN Service card.
-
Move the new card next to the original card if needed.
-
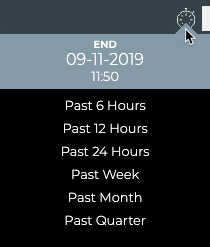
Change the time period for the data on the new card by hovering over the card and clicking
 .
. -
Select the time period that you want to compare with the current time.
You can now see whether there are significant differences between this time period and the previous time period.
If the changes are unexpected, you can investigate further by looking at another timeframe, determining if more nodes are now running EVPN than previously, looking for changes in the topology, and so forth.
View Devices with the Most Layer 2 EVPN Sessions
You can view the number layer 2 EVPN sessions on your switches and hosts using the large EVPN Service card. This data enables you to see which switches are handling the most EVPN traffic currently, validate that is what is expected based on your network design, and compare that with data from an earlier time to look for any differences.
To view switches and hosts with the most layer 2 EVPN sessions:
-
Open the large EVPN Service card.
-
Select Switches with Most L2 EVPN from the filter above the table.
The table content is sorted by this characteristic, listing nodes running the most layer 2 EVPN sessions at the top. Scroll down to view those with the fewest sessions.

To compare this data with the same data at a previous time:
-
Open another large EVPN Service card.
-
Move the new card next to the original card if needed.
-
Change the time period for the data on the new card by hovering over the card and clicking
. -
Select the time period that you want to compare with the current time.
You can now see whether there are significant differences between this time period and the previous time period.

If the changes are unexpected, you can investigate further by looking at another timeframe, determining if more nodes are now running EVPN than previously, looking for changes in the topology, and so forth.
View Devices with the Most Layer 3 EVPN Sessions
You can view the number layer 3 EVPN sessions on your switches and hosts using the large EVPN Service card. This data enables you to see which switches are handling the most EVPN traffic currently, validate that is what is expected based on your network design, and compare that with data from an earlier time to look for any differences.
To view switches and hosts with the most layer 3 EVPN sessions:
-
Open the large EVPN Service card.
-
Select Switches with Most L3 EVPN from the filter above the table.
The table content is sorted by this characteristic, listing nodes running the most layer 3 EVPN sessions at the top. Scroll down to view those with the fewest sessions.
To compare this data with the same data at a previous time:
-
Open another large EVPN Service card.
-
Move the new card next to the original card if needed.
-
Change the time period for the data on the new card by hovering over the card and clicking
. -
Select the time period that you want to compare with the current time.
You can now see whether there are significant differences between this time period and the previous time period.

If the changes are unexpected, you can investigate further by looking at another timeframe, determining if more nodes are now running EVPN than previously, looking for changes in the topology, and so forth.
View Devices with the Most EVPN-related Alarms
Switches experiencing a large number of EVPN alarms may indicate a configuration or performance issue that needs further investigation. You can view the switches sorted by the number of BGP alarms and then use the Switches card workflow or the Alarms card workflow to gather more information about possible causes for the alarms.
To view switches with the most EVPN alarms:
-
Open the large EVPN Service card.
-
Hover over the header and click
 .
. -
Select Events by Most Active Device from the filter above the table.
The table content is sorted by this characteristic, listing nodes with the most EVPN alarms at the top. Scroll down to view those with the fewest alarms.
Where to go next depends on what data you see, but a few options include:
- Hover over the Total Alarms chart to focus on the switches exhibiting alarms during that smaller time slice. The table content changes to match the hovered content. Click on the chart to persist the table changes.
- Change the time period for the data to compare with a prior time. If the same switches are consistently indicating the most alarms, you might want to look more carefully at those switches using the Switches card workflow.
- Click Show All Sessions to investigate all EVPN sessions network-wide in the full screen card.
View All EVPN Events
The EVPN Service card workflow enables you to view all of the EVPN events in the designated time period.
To view all EVPN events:
-
Open the full screen EVPN Service card.
-
Click All Alarms tab in the navigation panel. By default, events are sorted by Time, with most recent events listed first.
Where to go next depends on what data you see, but a few options include:
- Open one of the other full screen tabs in this flow to focus on devices or sessions.
- Sort by the Message or Severity to narrow your focus.
- Export the data for use in another analytics tool, by selecting all or some of the events and clicking
 .
. - Click
 at the top right to return to your workbench.
View Details for All Devices Running EVPN
You can view all stored attributes of all switches running EVPN in your network in the full screen card.
To view all switch and host details, open the full screen EVPN Service card, and click the All Switches tab.
To return to your workbench, click ![]() at the top right.
at the top right.
View Details for All EVPN Sessions
You can view all stored attributes of all EVPN sessions in your network in the full screen card.
To view all session details, open the full screen EVPN Service card, and click the All Sessions tab.
To return to your workbench, click ![]() at the top right.
at the top right.
Use the icons above the table to select/deselect, filter, and export items in the list. Refer to Table Settings for more detail.
To return to original display of results, click the associated tab.
Monitor a Single EVPN Session
With NetQ, you can monitor the performance of a single EVPN session, including the number of associated VNI, VTEPs and type. For an overview and how to configure EVPN in your data center network, refer to Ethernet Virtual Private Network - EVPN.
To access the single session cards, you must open the full screen EVPN Service, click the All Sessions tab, select the desired session, then click ![]() (Open Cards).
(Open Cards).
EVPN Session Card Workflow Summary
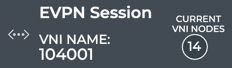
The small EVPN Session card displays:
| Item | Description |
|---|---|
| Indicates data is for an EVPN session | |
| Title | EVPN Session |
| VNI Name | Name of the VNI (virtual network instance) used for this EVPN session |
| Current VNI Nodes | Total number of VNI nodes participating in the EVPN session currently |
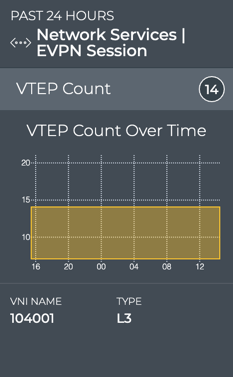
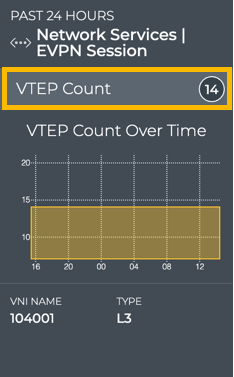
The medium EVPN Session card displays:
| Item | Description |
|---|---|
| Time period | Range of time in which the displayed data was collected; applies to all card sizes |
| Indicates data is for an EVPN session | |
| Title | Network Services | EVPN Session |
| Summary bar | VTEP (VXLAN Tunnel EndPoint) Count: Total number of VNI nodes participating in the EVPN session currently |
| VTEP Count Over Time chart | Distribution of VTEP counts during the designated time period |
| VNI Name | Name of the VNI used for this EVPN session |
| Type | Indicates whether the session is established as part of a layer 2 or layer 3 overlay network |
The large EVPN Session card contains two tabs.
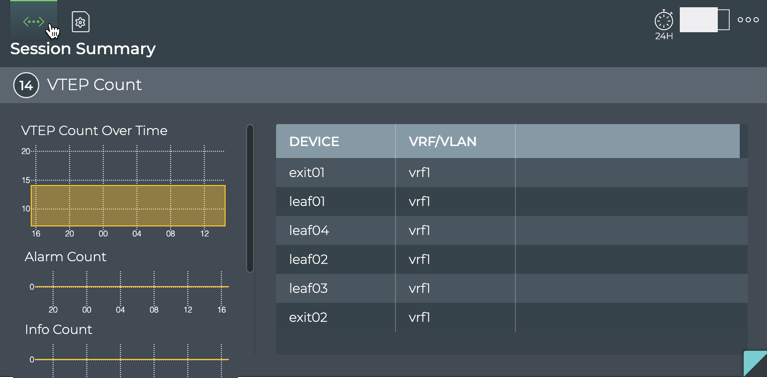
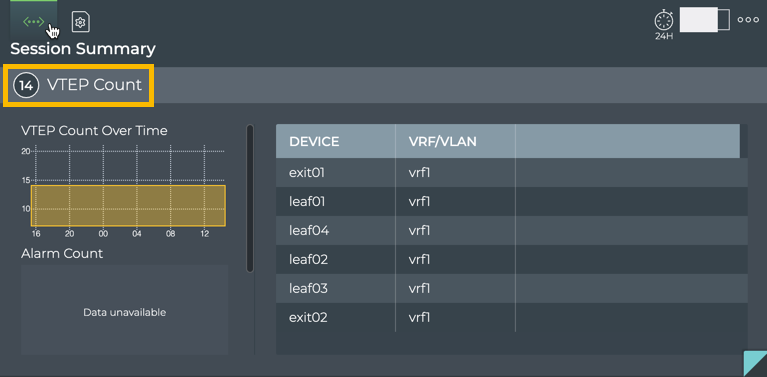
The Session Summary tab displays:
| Item | Description |
|---|---|
| Time period | Range of time in which the displayed data was collected; applies to all card sizes |
| Indicates data is for an EVPN session | |
| Title | Session Summary (Network Services | EVPN Session) |
| Summary bar | VTEP (VXLAN Tunnel EndPoint) Count: Total number of VNI devices participating in the EVPN session currently |
| VTEP Count Over Time chart | Distribution of VTEPs during the designated time period |
| Alarm Count chart | Distribution of alarms during the designated time period |
| Info Count chart | Distribution of info events during the designated time period |
| Table | VRF (for layer 3) or VLAN (for layer 2) identifiers by device |
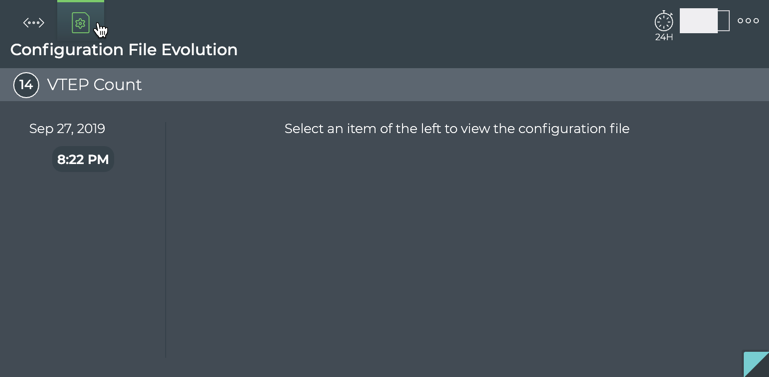
The Configuration File Evolution tab displays:
| Item | Description |
|---|---|
| Time period | Range of time in which the displayed data was collected; applies to all card sizes |
| Indicates configuration file information for a single session of a Network Service or Protocol | |
| Title | (Network Services | EVPN Session) Configuration File Evolution |
| VTEP count (currently) | |
| Timestamps | When changes to the configuration file have occurred, the date and time are indicated. Click the time to see the changed file. |
| Configuration File | When File is selected, the configuration file as it was at the selected time is shown. When Diff is selected, the configuration file at the selected time is shown on the left and the configuration file at the previous timestamp is shown on the right. Differences are highlighted. Note: If no configuration file changes have been made, only the original file date is shown. |
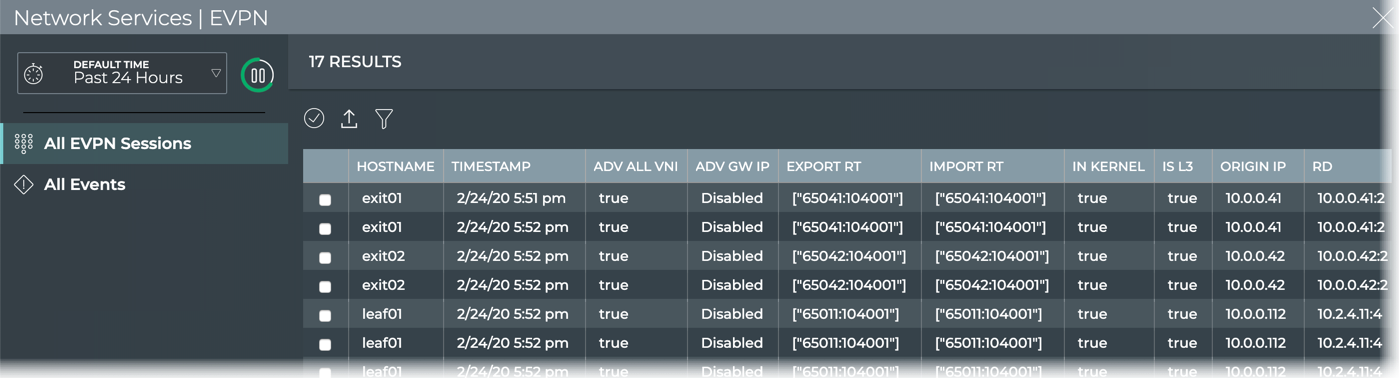
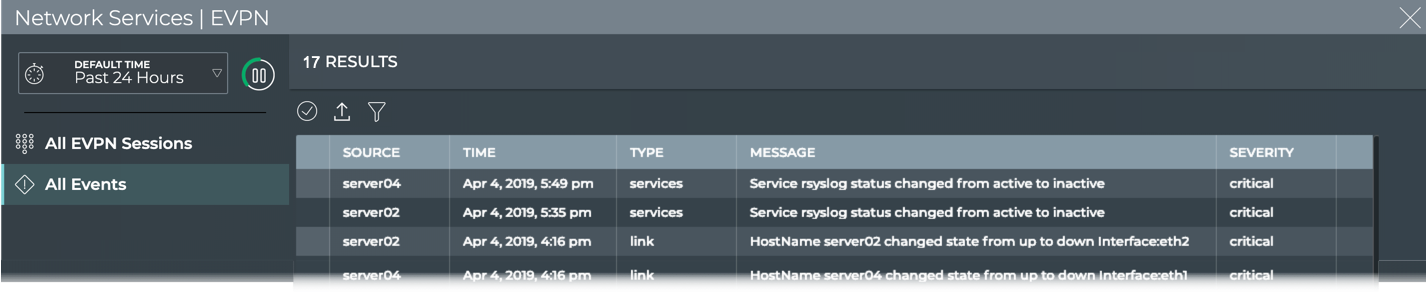
The full screen EVPN Session card provides tabs for all EVPN sessions and all events.
| Item | Description |
|---|---|
| Title | Network Services | EVPN |
| Closes full screen card and returns to workbench | |
| Time period | Range of time in which the displayed data was collected; applies to all card sizes; select an alternate time period by clicking |
| Displays data refresh status. Click |
|
| Results | Number of results found for the selected tab |
| All EVPN Sessions tab | Displays all EVPN sessions network-wide. By default, the session list is sorted by hostname. This tab provides the following additional data about each session:
|
| All Events tab | Displays all events network-wide. By default, the event list is sorted by time, with the most recent events listed first. The tab provides the following additional data about each event:
|
| Table Actions | Select, export, or filter the list. Refer to Table Settings. |
View Session Status Summary
A summary of the EVPN session is available from the EVPN Session card workflow, showing the node and its peer and current status.
To view the summary:
-
Add the Network Services | All EVPN Sessions card.
-
Switch to the full screen card.
-
Click the All Sessions tab.
-
Double-click the session of interest. The full screen card closes automatically.
-
Optionally, switch to the small EVPN Session card.
For more detail, select a different size EVPN Session card.
View VTEP Count
You can view the count of VTEPs for a given EVPN session from the medium and large EVPN Session cards.
To view the count for a given EVPN session, on the medium EVPN Session card:
-
Add the Network Services | All EVPN Sessions card.
-
Switch to the full screen card.
-
Click the All Sessions tab.
-
Double-click the session of interest. The full screen card closes automatically.
To view the count for a given EVPN session on the large EVPN Session card, follow the same steps as for the medium card and then switch to the large card.
View All EVPN Session Details
You can view all stored attributes of all of the EVPN sessions running network-wide.
To view all session details, open the full screen EVPN Session card and click the All EVPN Sessions tab.
To return to your workbench, click ![]() in the top right of the card.
in the top right of the card.
View All Events
You can view all of the alarm and info events occurring network wide.
To view all events, open the full screen EVPN Session card and click the All Events tab.
Where to go next depends on what data you see, but a few options include:
- Open one of the other full screen tabs in this flow to focus on sessions.
- Sort by the Message or Severity to narrow your focus.
- Export the data for use in another analytics tool, by selecting all or some of the events and clicking .
- Click at the top right to return to your workbench.