Monitor Network Elements
In addition to network performance monitoring, the Cumulus NetQ UI provides a view into the current status and configuration of the network elements in a tabular, network-wide view. These are helpful when you want to see all data for all of a particular element in your network for troubleshooting, or you want to export a list view.
Some of these views provide data that is also available through the card workflows, but these views are not treated like cards. They only provide the current status; you cannot change the time period of the views, or graph the data within the UI.
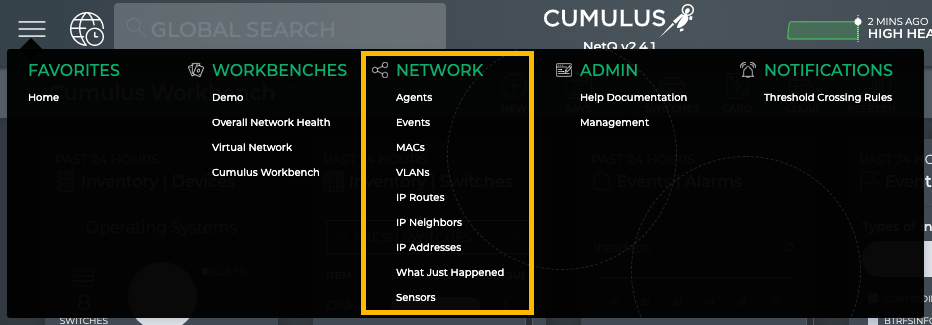
Access these tables through the Main Menu (), under the Network heading.
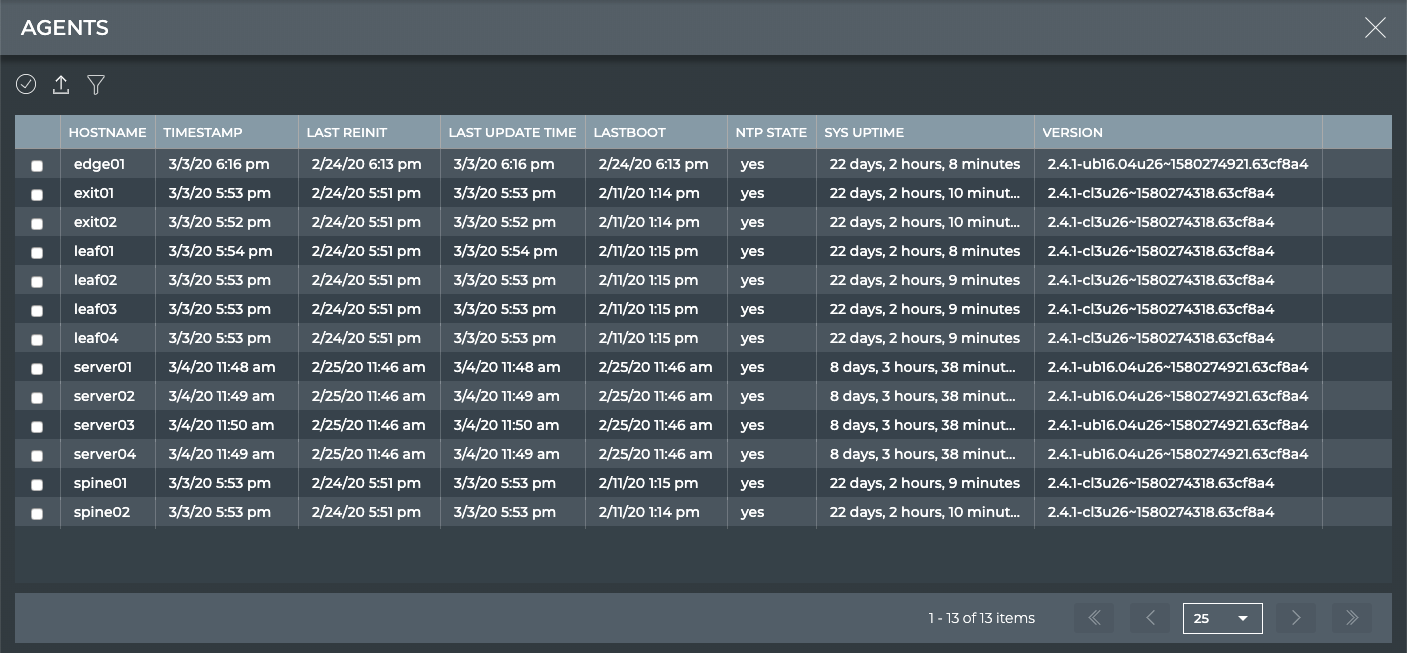
For NetQ 2.4.1, the tables can be manipulated using the settings above the tables, shown here and described in Table Settings.

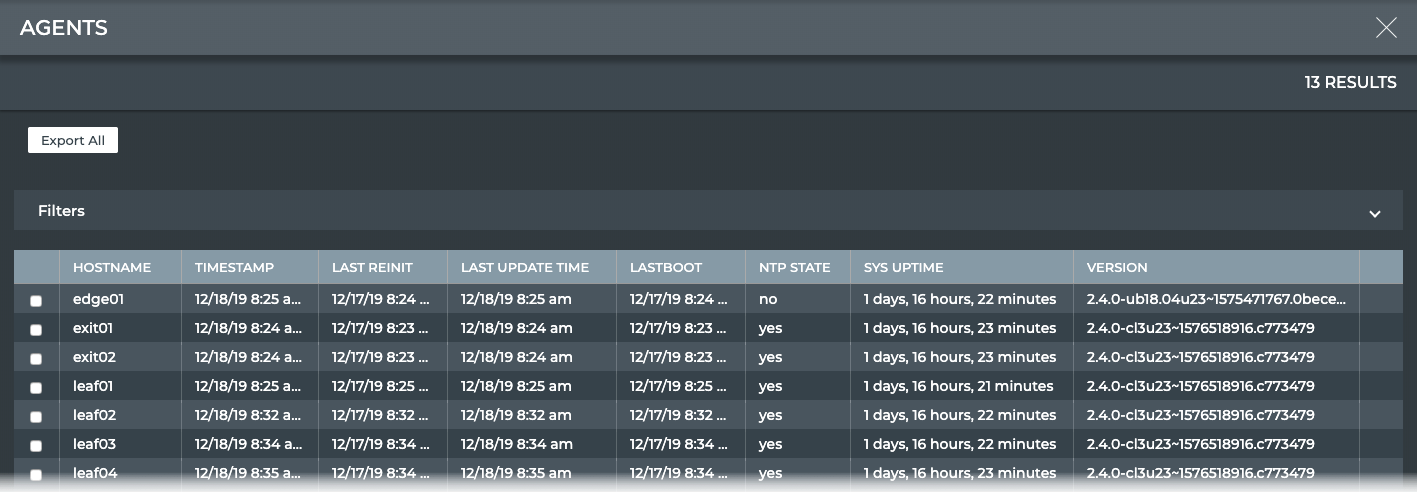
For NetQ 2.4.0, you can use the filter function at the top of the table. Expand and collapse the filter by clicking the down and up arrow in the title bar.

You can filter the list of items by selecting a field, entering a meaningful value, and then clicking Apply. Click Clear to remove the filter.
View All NetQ Agents
The Agents view provides all available parameter data about all NetQ Agents in the system. The first figure shows the NetQ 2.4.0 view and the second figure shows the updated filtering and pagination provided in NetQ 2.4.1.
View All Events
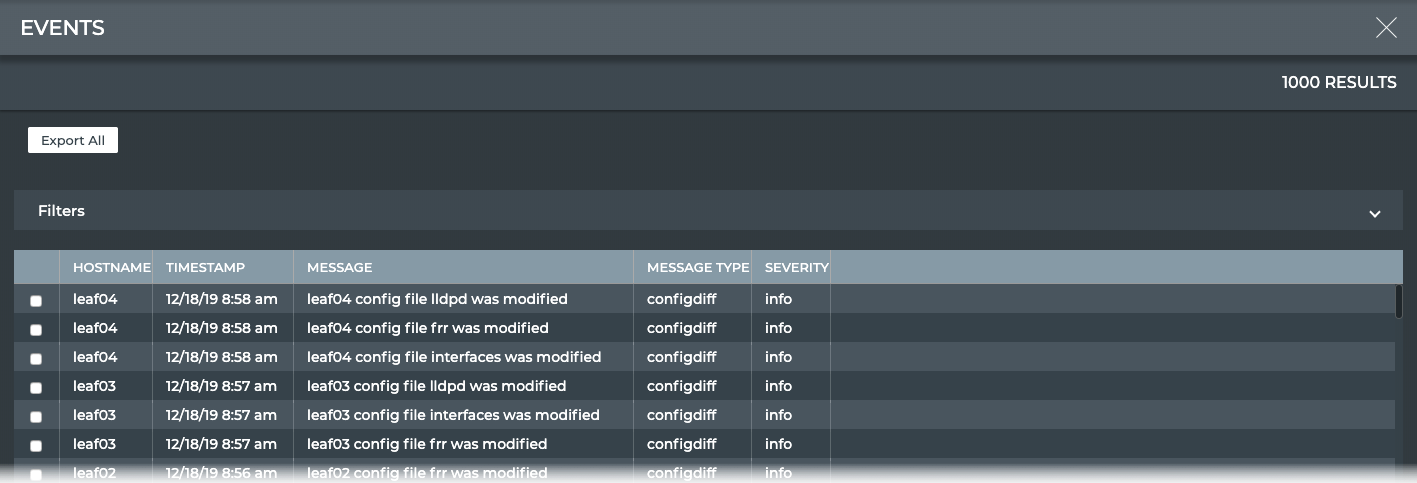
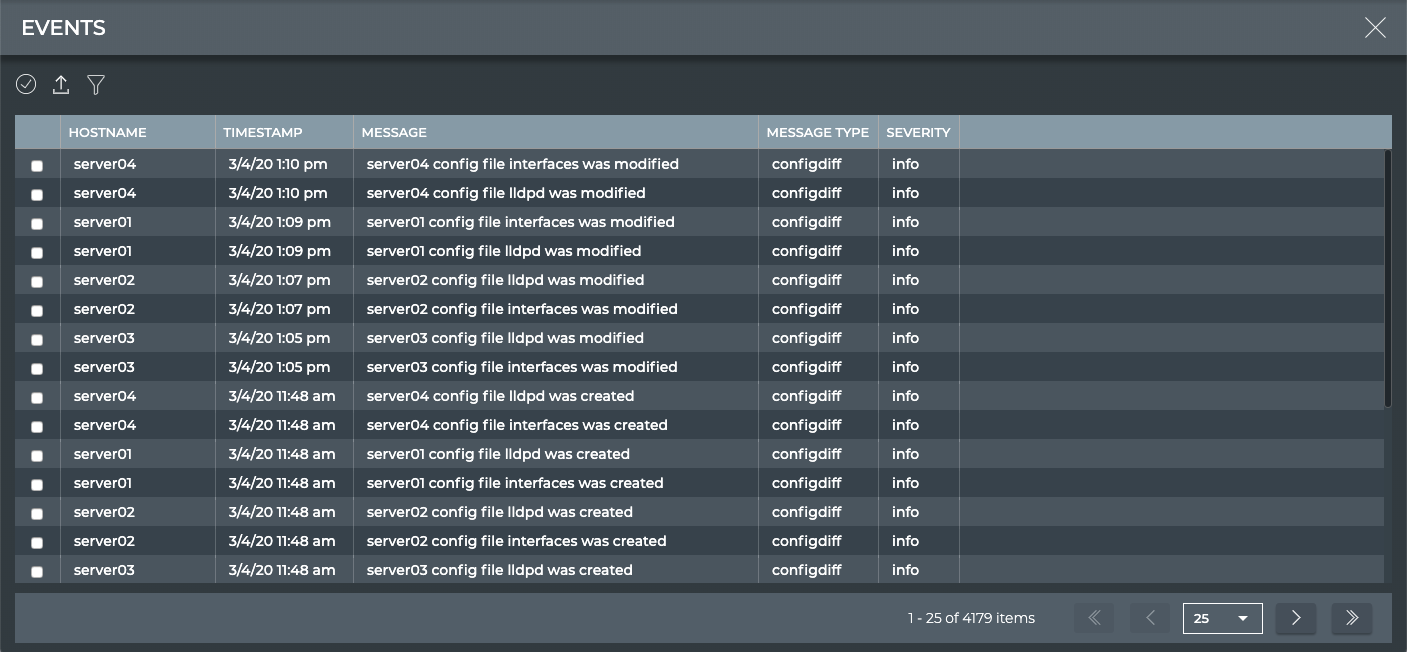
The Events view provides all available parameter data about all events in the system. The first figure shows the NetQ 2.4.0 view and the second figure shows the updated filtering and pagination provided in NetQ 2.4.1.
View All MACs
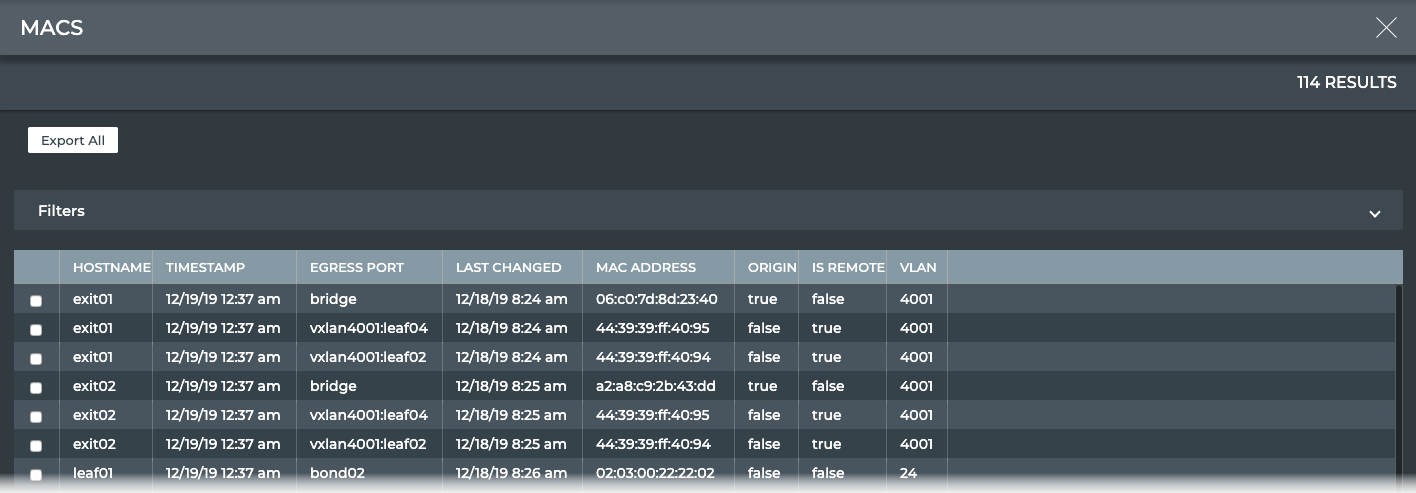
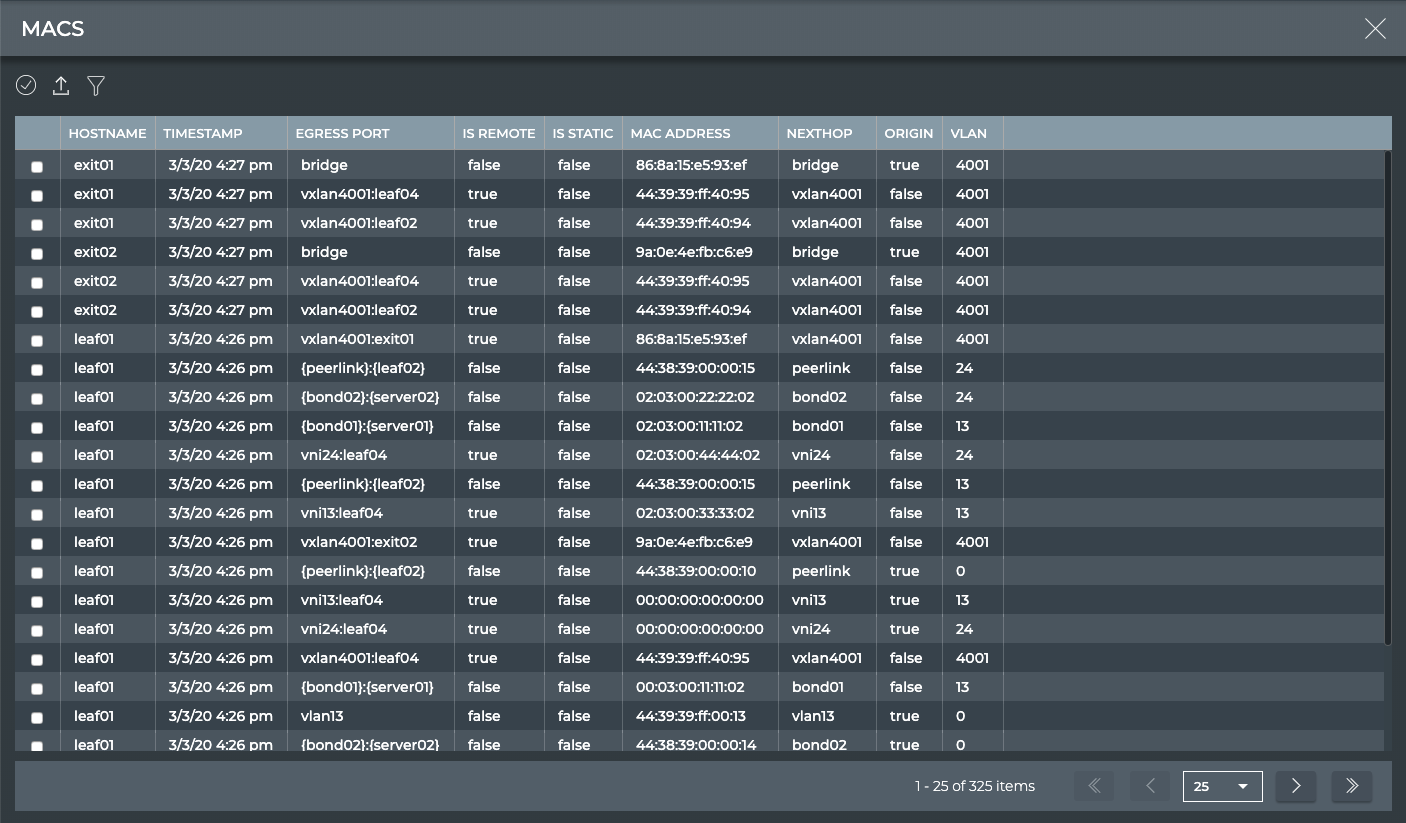
The MACs (media access control addresses) view provides all available parameter data about all MAC addresses in the system. The first figure shows the NetQ 2.4.0 view and the second figure shows the updated filtering and pagination provided in NetQ 2.4.1.
View All VLANs
The VLANs (virtual local area networks) view provides all available parameter data about all VLANs in the system. The first figure shows the NetQ 2.4.0 view and the second figure shows the updated filtering provided in NetQ 2.4.1. Pagination options are not shown as there must be more than 25 items before NetQ begins paginating results.


View All IP Routes
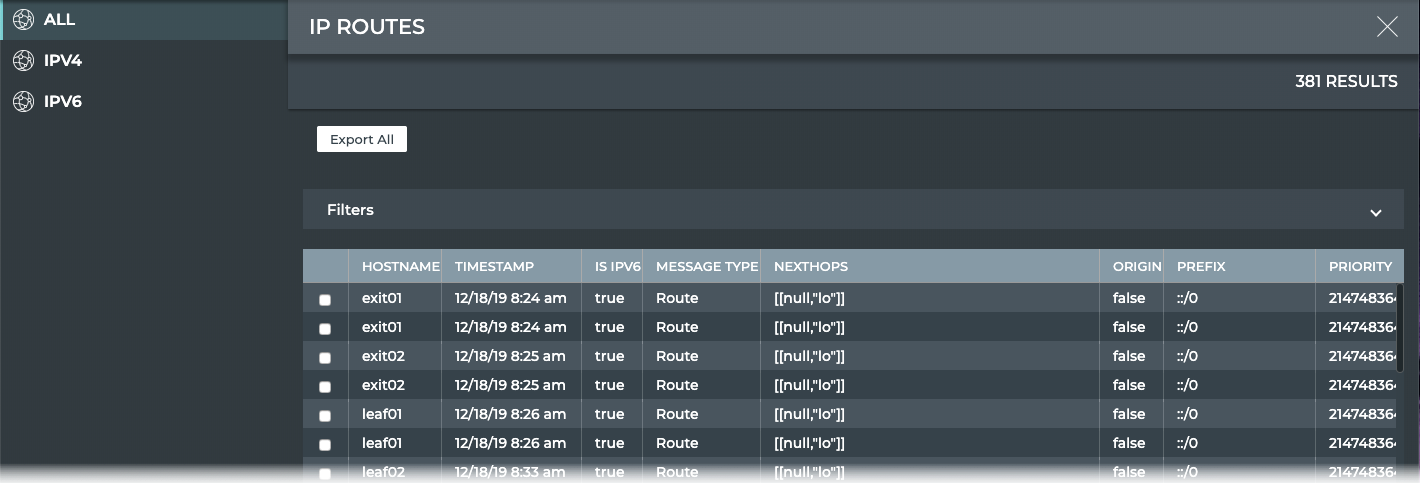
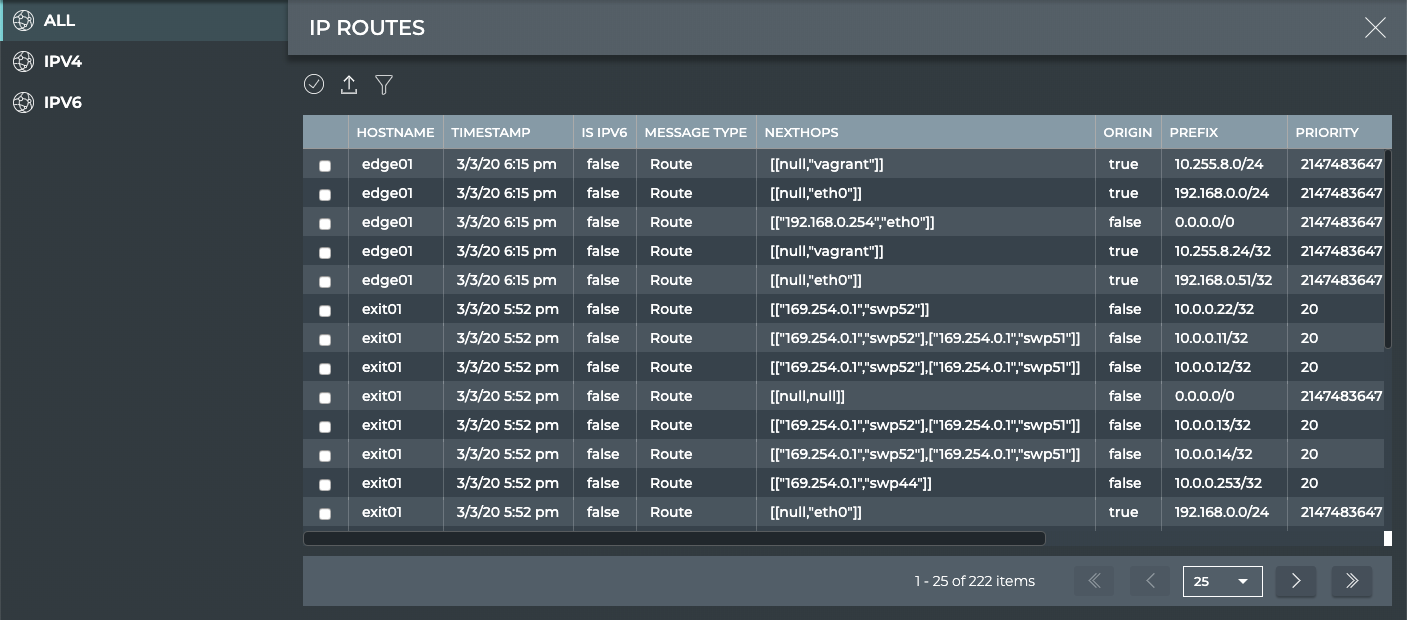
The IP Routes view provides all available parameter data about all IP routes, all IPv4 routes, and all IPv6 routes in the system. The first figure shows the NetQ 2.4.0 view and the second figure shows the updated filtering and pagination provided in NetQ 2.4.1.
View All IP Neighbors
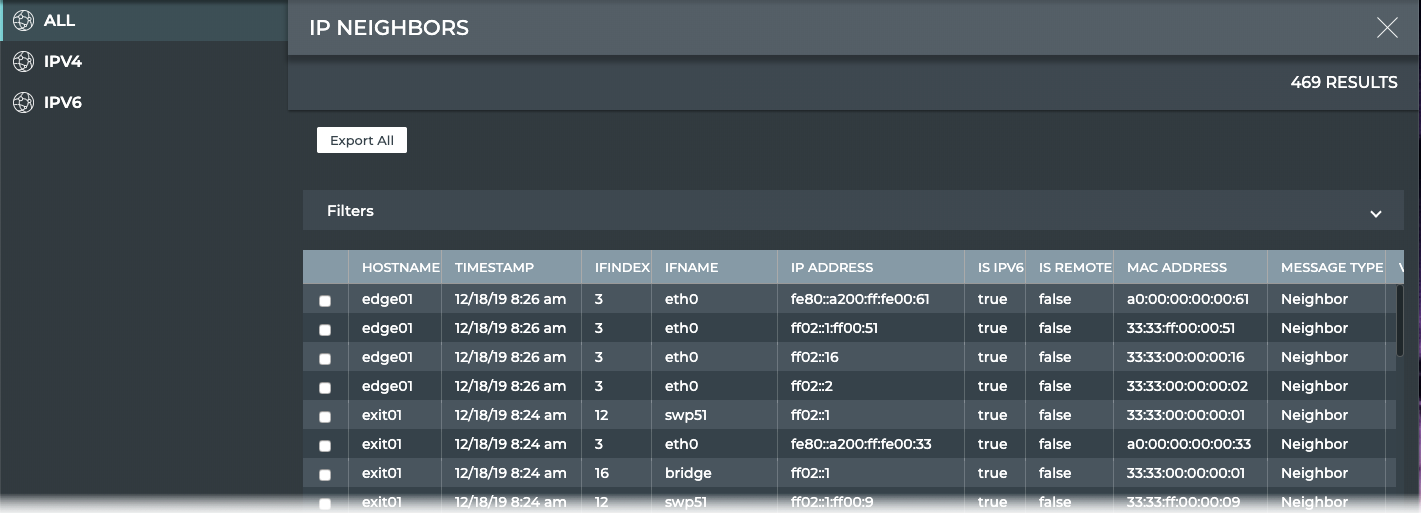
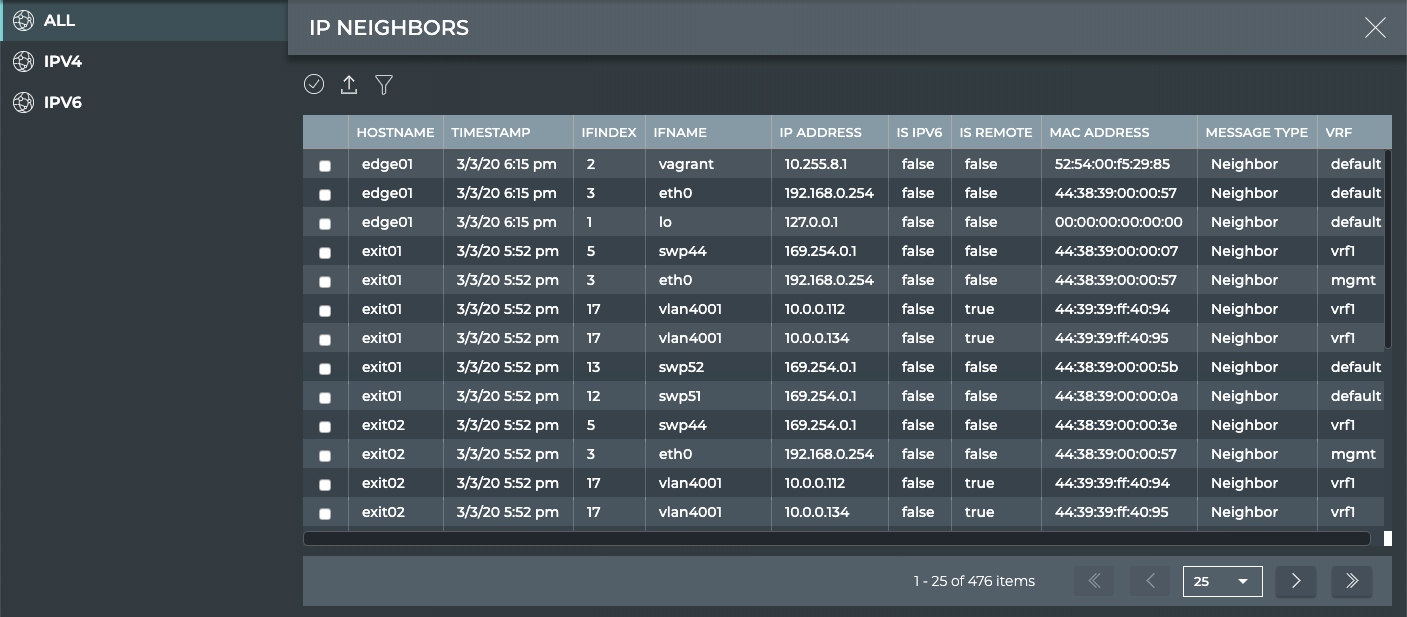
The IP Neighbors view provides all available parameter data about all IP neighbors, all IPv4 neighbors, and all IPv6 neighbors in the system. The first figure shows the NetQ 2.4.0 view and the second figure shows the updated filtering and pagination provided in NetQ 2.4.1.
View All IP Addresses
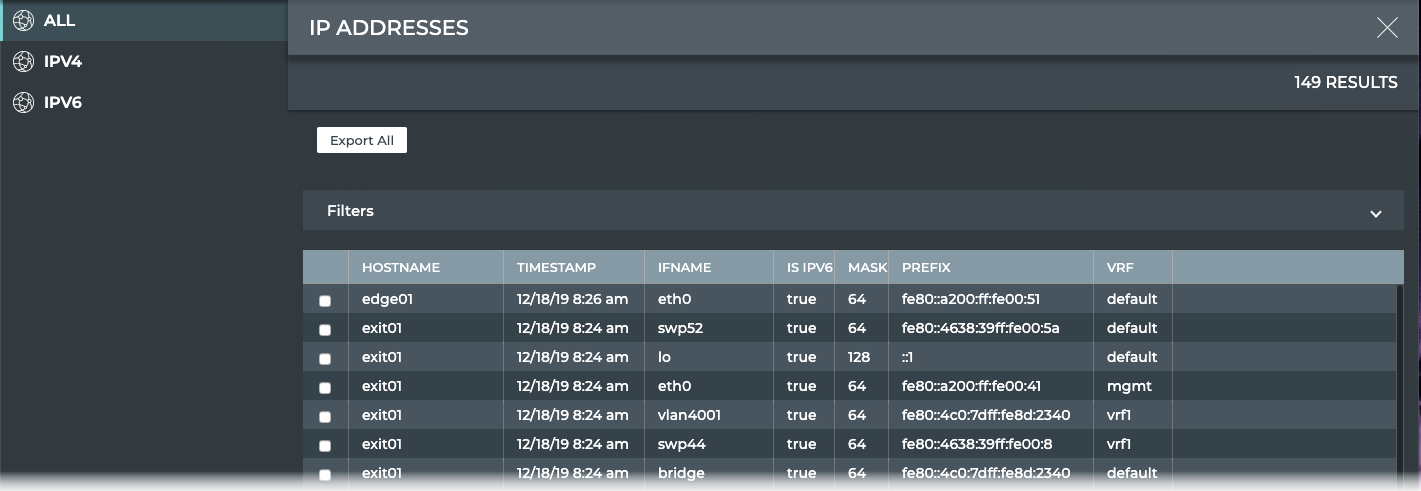
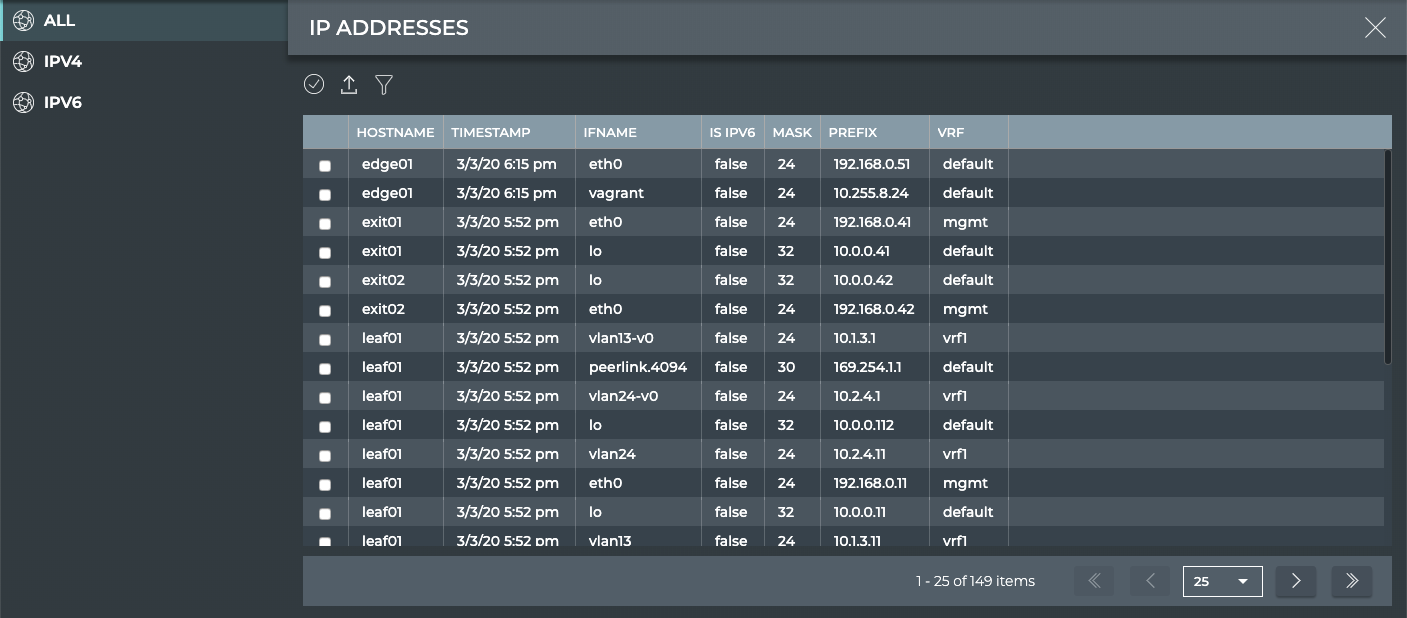
The IP Addresses view provides all available parameter data about all IP addresses, all IPv4 addresses, and all IPv6 addresses in the system. The first figure shows the NetQ 2.4.0 view and the second figure shows the updated filtering and pagination provided in NetQ 2.4.1.
View All Sensors
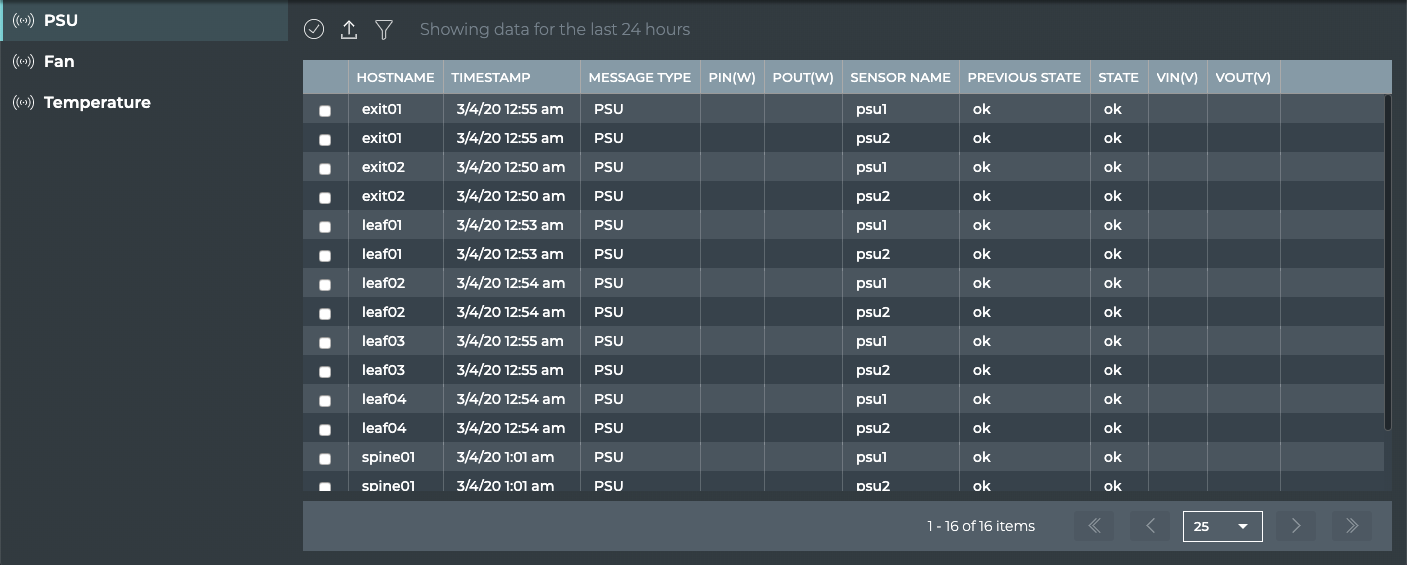
The Sensors view provides all available parameter data provided by the power supply units (PSUs), fans, and temperature sensors in the system. The feature is only available in NetQ 2.4.1 and later.
View What Just Happened
The What Just Happened (WJH) feature, available on Mellanox switches, streams detailed and contextual telemetry data for analysis. This provides real-time visibility into problems in the network, such as hardware packet drops due to buffer congestion, incorrect routing, and ACL or layer 1 problems. You must have Cumulus Linux 4.0.0 or later and NetQ 2.4.0 or later to take advantage of this feature.
If your switches are sourced from a vendor other than Mellanox, this view is blank as no data is collected.
When WJH capabilities are combined with Cumulus NetQ, you have the ability to hone in on losses, anywhere in the fabric, from a single management console. You can:
- View any current or historic drop information, including the reason for the drop
- Identify problematic flows or endpoints, and pin-point exactly where communication is failing in the network
By default, Cumulus Linux 4.0.0 provides the NetQ 2.3.1 Agent and CLI. If you installed Cumulus Linux 4.0.0 on your Mellanox switch, you need to upgrade the NetQ Agent and optionally the CLI to release 2.4.0 or later.
cumulus@<hostname>:~$ sudo apt-get update
cumulus@<hostname>:~$ sudo apt-get install -y netq-agent
cumulus@<hostname>:~$ netq config restart agent
cumulus@<hostname>:~$ sudo apt-get install -y netq-apps
cumulus@<hostname>:~$ netq config restart cli
Configure the WJH Feature
WJH is enabled by default on Mellanox switches and no configuration is required in Cumulus Linux 4.0.0; however, you must enable the NetQ Agent to collect the data in NetQ 2.4.0 or later.
To enable WJH in NetQ:
- Configure the NetQ Agent on the Mellanox switch.
cumulus@switch:~$ netq config add agent wjh
- Restart the NetQ Agent to start collecting the WJH data.
cumulus@switch:~$ netq config restart agent
When you are finished viewing the WJH metrics, you might want to disable the NetQ Agent to reduce network traffic. Use netq config del agent wjh followed by netq config restart agent to disable the WJH feature on the given switch.
Using wjh_dump.py on a Mellanox platform that is running Cumulus Linux 4.0 and the NetQ 2.4.0 agent causes the NetQ WJH client to stop receiving packet drop call backs. To prevent this issue, run wjh_dump.py on a different system than the one where the NetQ Agent has WJH enabled, or disable wjh_dump.py and restart the NetQ Agent (run netq config restart agent).
View What Just Happened Metrics
The What Just Happened view displays events based on conditions detected in the data plane. The most recent 1000 events from the last 24 hours are presented for each drop category.

| Item | Description |
|---|---|
| Title | What Just Happened |
| Closes full screen card and returns to workbench | |
| Results | Number of results found for the selected tab |
| L1 Drops tab | Displays the reason why a port is in the down state. By default, the listing is sorted by Last Timestamp. The tab provides the following additional data about each drop event:
|
| L2 Drops tab | Displays the reason for a link to be down. By default, the listing is sorted by Last Timestamp. The tab provides the following additional data about each drop event:
|
| Router Drops tab | Displays the reason why the server is unable to route a packet. By default, the listing is sorted by Last Timestamp. The tab provides the following additional data about each drop event:
|
| Tunnel Drops tab | Displays the reason for a tunnel to be down. By default, the listing is sorted by Last Timestamp. The tab provides the following additional data about each drop event:
|
| Buffer Drops tab | Displays the reason for the server buffer to be drop packets. By default, the listing is sorted by Last Timestamp. The tab provides the following additional data about each drop event:
|
| ACL Drops tab | Displays the reason for an ACL to be (something?). By default, the listing is sorted by Last Timestamp. The tab provides the following additional data about each drop event:
|
| Table Actions | Select, export, or filter the list. Refer to Table Settings. |