Monitor Critical Events
You can easily monitor critical events occurring across your network using the Alarms card. You can determine the number of events for the various system, interface, and network protocols and services components in the network. The content of the cards in the workflow is described first, and then followed by common tasks you would perform using this card workflow.
Alarms Card Workflow Summary
The small Alarms card displays:
| Item | Description |
|---|---|
| Indicates data is for all critical severity events in the network | |
| Alarm trend | Trend of alarm count, represented by an arrow:
|
| Alarm score | Current count of alarms during the designated time period |
| Alarm rating | Count of alarms relative to the average count of alarms during the designated time period:
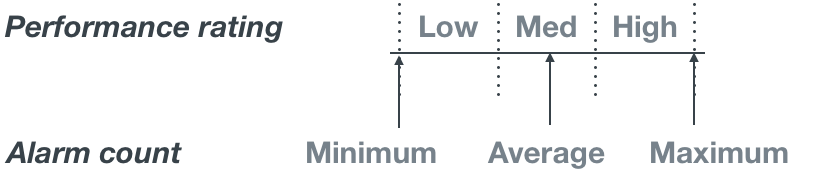
|
| Chart | Distribution alarms received during the designated time period and a total count of all alarms present in the system |
The medium Alarms card displays:
| Item | Description |
|---|---|
| Time period | Range of time in which the displayed data was collected; applies to all card sizes |
| Indicates data is for all critical events in the network | |
| Count | Total number of alarms received during the designated time period |
| Alarm score | Current count of alarms received from each category (overall, system, interface, and network services) during the designated time period |
| Chart | Distribution of all alarms received from each category during the designated time period |
The large Alarms card has one tab.
The Alarm Summary tab displays:
| Item | Description |
|---|---|
| Time period | Range of time in which the displayed data was collected; applies to all card sizes |
| Indicates data is for all system, trace and interface critical events in the network | |
| Alarm Distribution | Chart: Distribution of all alarms received from each category during the designated time period:
Count: Total number of alarms received from each category during the designated time period |
| Table | Listing of items that match the filter selection for the selected alarm categories:
|
| Show All Events | Opens full screen Events | Alarms card with a listing of all events |
The full screen Alarms card provides tabs for all events.
| Item | Description |
|---|---|
| Title | Events | Alarms |
| Closes full screen card and returns to workbench | |
| Default Time | Range of time in which the displayed data was collected |
| Displays data refresh status. Click |
|
| Results | Number of results found for the selected tab |
| All Events | Displays all events (both alarms and info) received in the time period. By default, the requests list is sorted by the date and time that the event occurred (Time). This tab provides the following additional data about each request:
|
| Table Actions | Select, export, or filter the list. Refer to Table Settings. |
View Alarm Status Summary
A summary of the critical alarms in the network includes the number of alarms, a trend indicator, a performance indicator, and a distribution of those alarms.
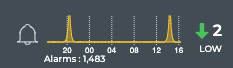
To view the summary, open the small Alarms card.
In this example, there are a small number of alarms (2), the number of alarms is decreasing (down arrow), and there are fewer alarms right now than the average number of alarms during this time period. This would indicate no further investigation is needed. Note that with such a small number of alarms, the rating may be a bit skewed.
View the Distribution of Alarms
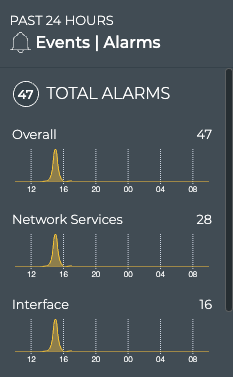
It is helpful to know where and when alarms are occurring in your network. The Alarms card workflow enables you to see the distribution of alarms based on its source-network services, interfaces, or other system services. You can also view the trend of alarms in each source category.
To view the alarm distribution, open the medium Alarms card. Scroll down to view all of the charts.
Monitor System and Interface Alarm Details
The Alarms card workflow enables users to easily view and track critical severity system and interface alarms occurring anywhere in your network.
View All System and Interface Alarms
You can view the alarms associated with the system and interfaces using the Alarms card workflow. You can sort alarms based on their occurrence or view devices with the most network services alarms.
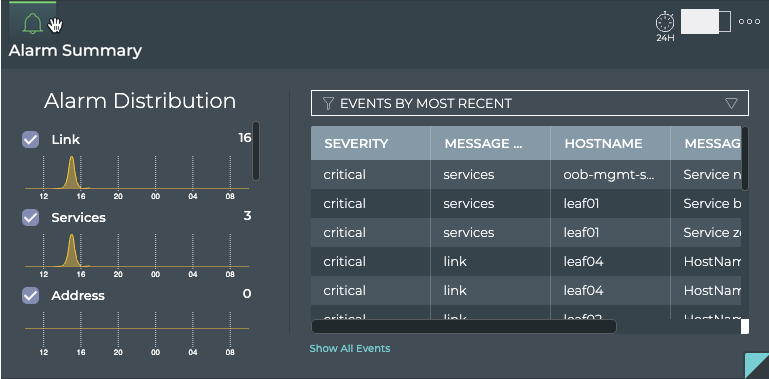
To view network services alarms, open the large Alarms card.
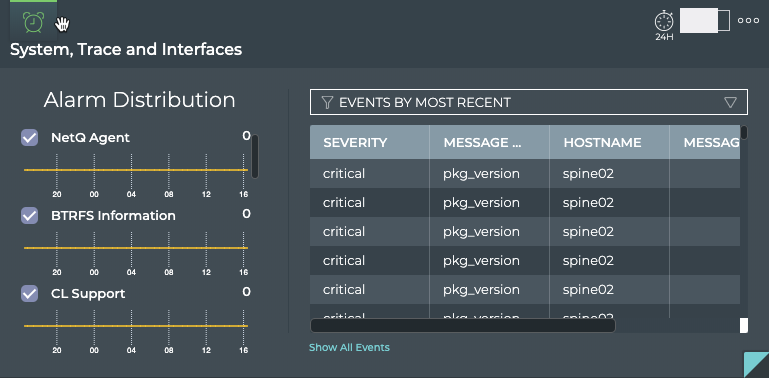
From this card, you can view the distribution of alarms for each of the categories over time. The charts are sorted by total alarm count, with the highest number of alarms i a category listed at the top. Scroll down to view any hidden charts. A list of the associated alarms is also displayed. By default, the list of the most recent alarms for the systems and interfaces is displayed when viewing the large cards.
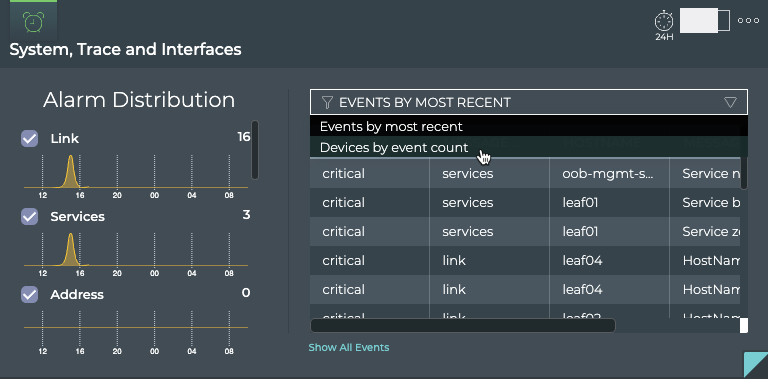
View Devices with the Most Alarms
You can filter instead for the devices that have the most alarms.
To view devices with the most alarms, open the large Alarms card, and then select Devices by event count from the dropdown.
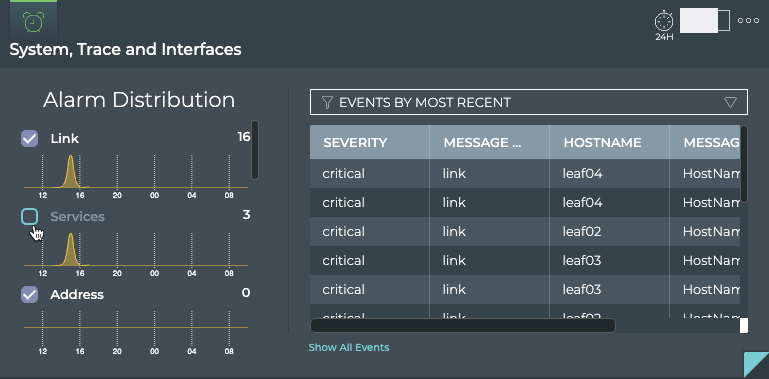
Filter Alarms by Category
You can focus your view to include alarms for one or more selected alarm categories.
To filter for selected categories:
-
Click the checkbox to the left of one or more charts to remove that set of alarms from the table on the right.
-
Select the Devices by event count to view the devices with the most alarms for the selected categories.
-
Switch back to most recent events by selecting Events by most recent.
-
Click the checkbox again to return a category’s data to the table.
In this example, we removed the Services from the event listing.
Compare Alarms with a Prior Time
You can change the time period for the data to compare with a prior time. If the same devices are consistently indicating the most alarms, you might want to look more carefully at those devices using the Switches card workflow.
To compare two time periods:
-
Open a second Alarm Events card. Remember it goes to the bottom of the workbench.
-
Switch to the large size view.
-
Move the card to be next to the original Alarm Events card. Note that moving large cards can take a few extra seconds since they contain a large amount of data.
-
Hover over the card and click
 .
.
-
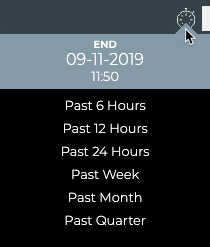
Select a different time period.
-
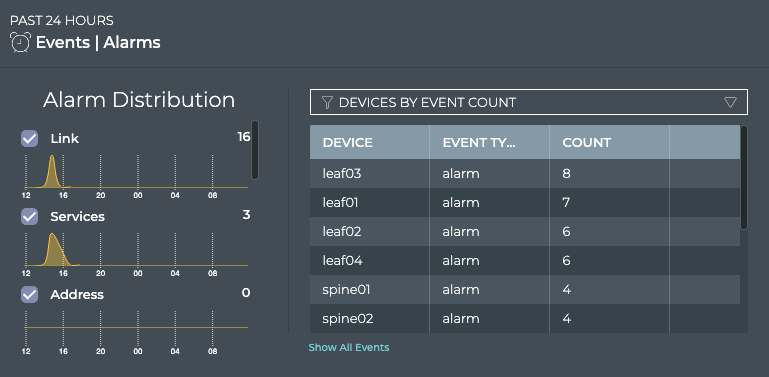
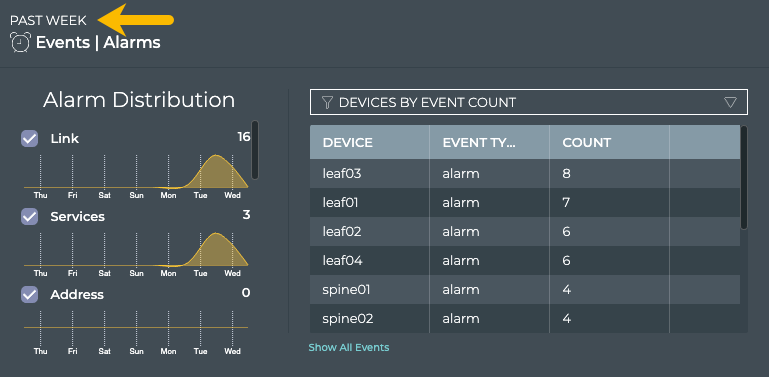
Compare the two cards with the Devices by event count filter applied.
In this example, both the total alarm count and the devices with the most alarms in each time period are unchanged. You could go back further in time to see if this changes or investigate the current status of the largest offenders.
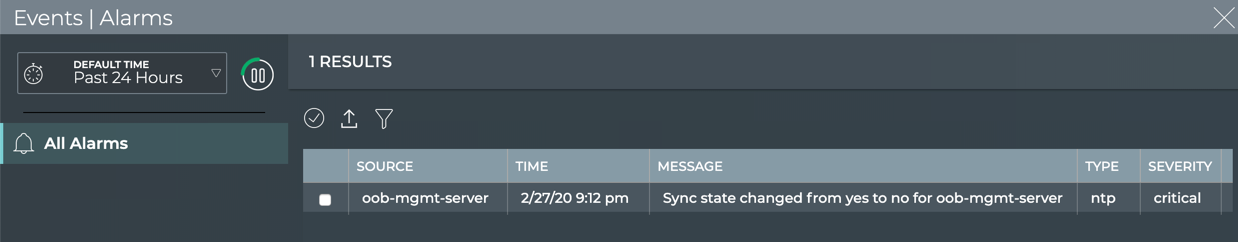
View All Events
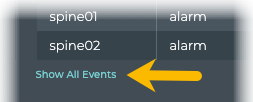
You can view all events in the network either by clicking the Show All Events link under the table on the large Alarm Events card, or by opening the full screen Alarm Events card.
OR
To return to your workbench, click ![]() in the top right corner of the card.
in the top right corner of the card.