Monitor Switches
With the NetQ UI, you can monitor individual switches separately from the network. You are able to view the status of services they are running, health of its various components, and connectivity performance. Being able to monitor switch component inventory aids in upgrade, compliance, and other planning tasks. Viewing individual switch health helps isolate performance issues.
For network-wide monitoring, refer to Monitor Network Performance.
Monitor Switch Performance
Viewing detail about a particular switch is essential when troubleshooting performance issues. With NetQ you can view the overall performance and drill down to view attributes of the switch, interface performance and the events associated with a switch. This is accomplished through the Switches card.
Switch Card Workflow Summary
The small Switch card displays:
| Item | Description |
|---|---|
| Indicates data is for a single switch | |
| title | Hostname of switch |
| Chart | Distribution of switch alarms during the designated time period |
| Trend | Trend of alarm count, represented by an arrow:
|
| Count | Current count of alarms on the switch |
| Rating | Overall performance of the switch. Determined by the count of alarms relative to the average count of alarms during the designated time period:
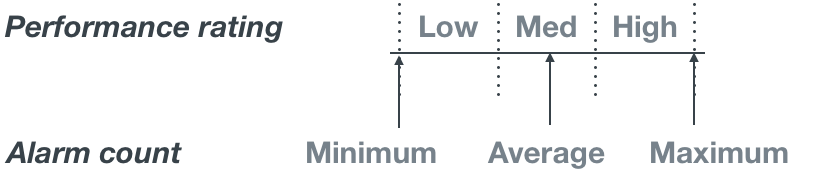
|
The medium Switch card displays:
| Item | Description |
|---|---|
| Indicates data is for a single switch | |
| title | Hostname of switch |
| Alarms | When selected, displays distribution and count of alarms by alarm category, generated by this switch during the designated time period |
| Charts | When selected, displays distribution of alarms by alarm category, during the designated time period |
The large Switch card contains three tabs:
The Attributes tab displays:
| Item | Description |
|---|---|
| Indicates data is for a single switch | |
| title | <Hostname> | Attributes |
| Hostname | User-defined name for this switch |
| Management IP | IPv4 or IPv6 address used for management of this switch |
| Management MAC | MAC address used for management of this switch |
| Agent State | Operational state of the NetQ Agent on this switch; Fresh or Rotten |
| Platform Vendor | Manufacturer of this switch box. Cumulus Networks is identified as the vendor for a switch in the Cumulus in the Cloud (CITC) environment, as seen here. |
| Platform Model | Manufacturer model of this switch. VX is identified as the model for a switch in CITC environment, as seen here. |
| ASIC Vendor | Manufacturer of the ASIC installed on the motherboard |
| ASIC Model | Manufacturer model of the ASIC installed on the motherboard |
| OS | Operating system running on the switch. CL indicates a Cumulus Linux license. |
| OS Version | Version of the OS running on the switch |
| NetQ Agent Version | Version of the NetQ Agent running on the switch |
| License State | Indicates whether the license is valid (ok) or invalid/missing (bad) |
| Total Interfaces | Total number of interfaces on this switch, and the number of those that are up and down. |
The Utilization tab displays:
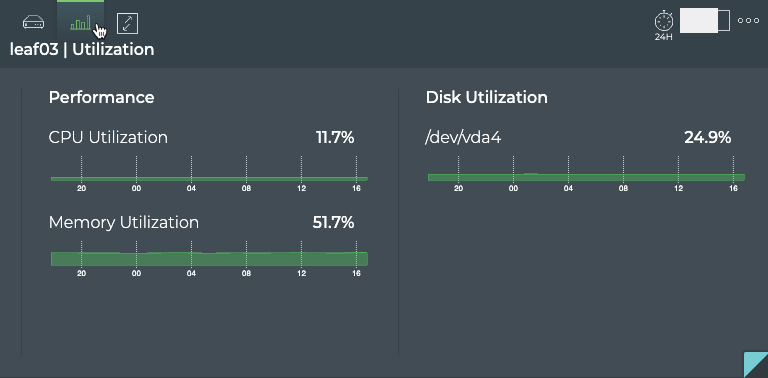
| Item | Description |
|---|---|
| Indicates utilization data is for a single switch | |
| Title | <Hostname> | Utilization |
| Performance | Displays distribution of CPU and memory usage during the designated time period |
| Disk Utilization | Displays distribution of disk usage during the designated time period |
The Interfaces tab displays:
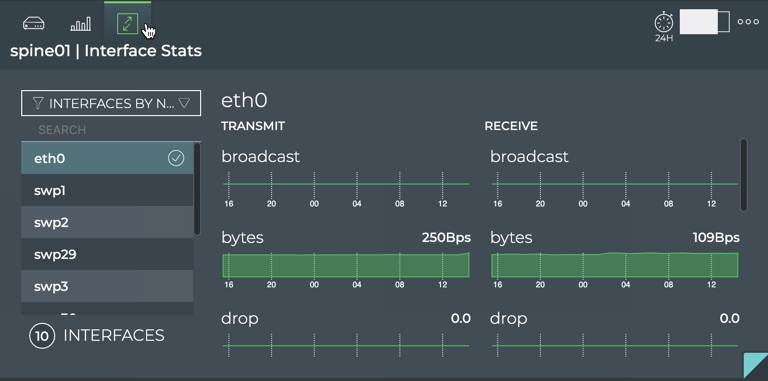
| Item | Description |
|---|---|
| Indicates interface statistics for a single switch | |
| Title | <Hostname> | Interface Stats |
| Interface List | List of interfaces present during the designated time period |
| Interface Filter | Sorts interface list by Name, Rx Util (receive utilization), or Tx Util (transmit utilization) |
| Interfaces Count | Number of interfaces present during the designated time period |
| Interface Statistics | Distribution and current value of various transmit and receive statistics associated with a selected interface:
|
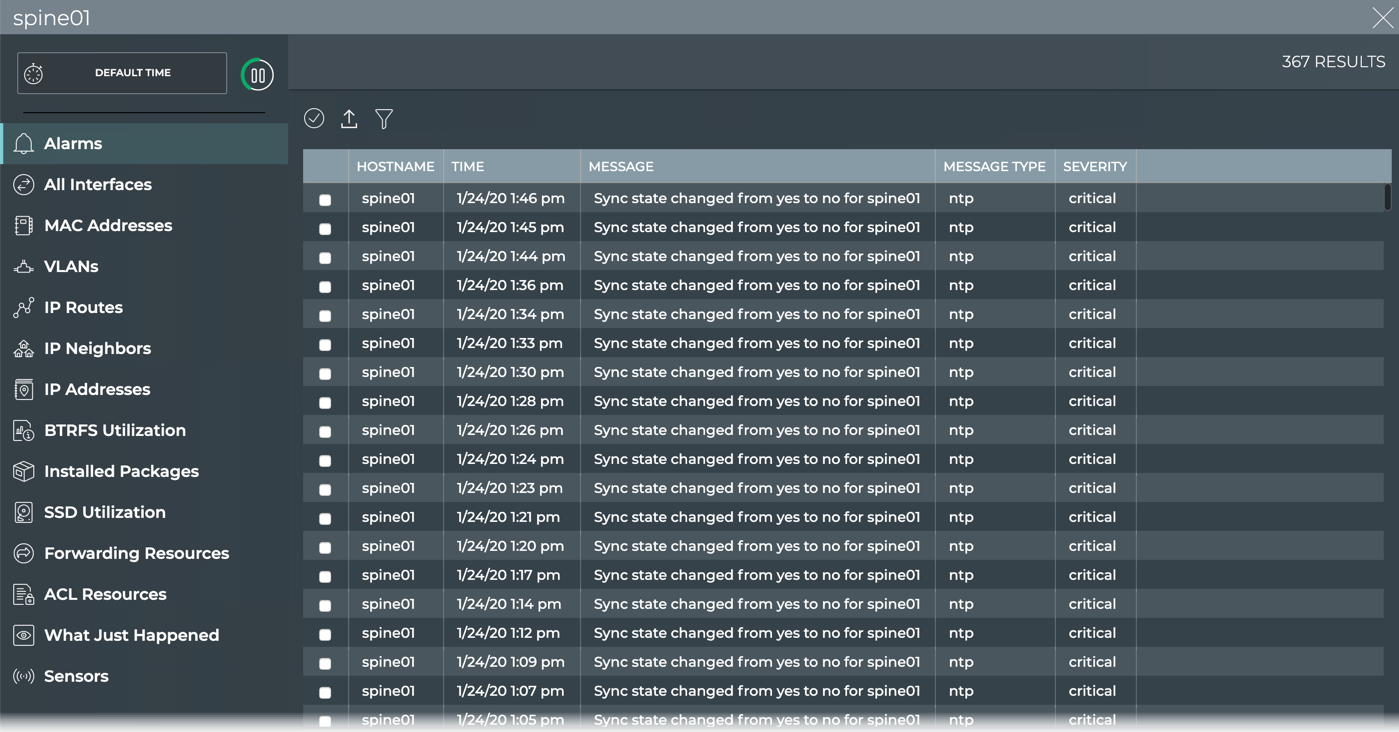
The full screen Switch card provides multiple tabs.
| Item | Description |
|---|---|
| Title | <hostname> |
| Closes full screenn card and returns to workbench | |
| Default Time | Displayed data is current as of this moment |
| Displays data refresh status. Click |
|
| Results | Number of results found for the selected tab |
| Alarms | Displays all known critical alarms for the switch. This tab provides the following additional data about each address:
|
| All Interfaces | Displays all known interfaces on the switch. This tab provides the following additional data about each interface:
|
| MAC Addresses | Displays all known MAC addresses for the switch. This tab provides the following additional data about each MAC address:
|
| VLANs | Displays all configured VLANs on the switch. This tab provides the following additional data about each VLAN:
|
| IP Routes | Displays all known IP routes for the switch. This tab provides the following additional data about each route:
|
| IP Neighbors | Displays all known IP neighbors of the switch. This tab provides the following additional data about each neighbor:
|
| IP Addresses | Displays all known IP addresses for the switch. This tab provides the following additional data about each address:
|
| BTRFS Utilization | Displays disk utilization information for devices running Cumulus Linux 3.x and the b-tree file system (BTRFS):
|
| Installed Packages | Displays all known interfaces on the switch. This tab provides the following additional data about each package:
|
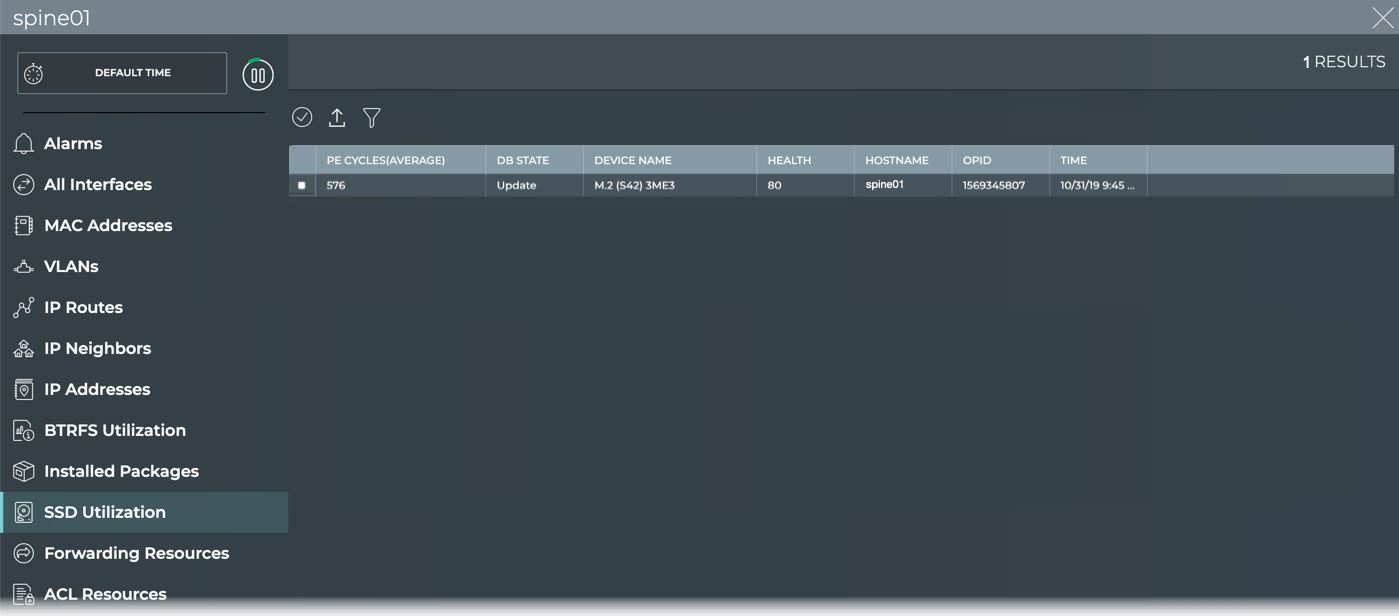
| SSD Utilization | Displays overall health and utilization of a 3ME3 solid state drive (SSD). This tab provides the following data about each drive:
|
| Forwarding Resources | Displays usage statistics for all forwarding resources on the switch. This tab provides the following additional data about each resource:
|
| ACL Resources | Displays usage statistics for all ACLs on the switch. The following is diplayed for each ACL:
|
| What Just Happened | Displays displays events based on conditions detected in the data plane on the switch. Refer to What Just Happened for descriptions of the fields in this table. |
| Sensors | Displays all known sensors on the switch. This tab provides a table for each type of sensor. Select the sensor type using the filter above the table.
|
| Table Actions | Select, export, or filter the list. Refer to Table Settings. |
View the Overall Health of a Switch
When you want to monitor the health of a particular switch, open the small Switch card. It is unlikely that you would have this card open for every switch in your network at the same time, but it is useful for tracking selected switches that may have been problematic in the recent past or that you have recently installed. The card shows you alarm status and summary performance score and trend.
To view the summary:
-
Click
 , and select Device|Switches. A dialog box opens.
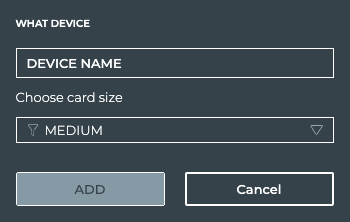
-
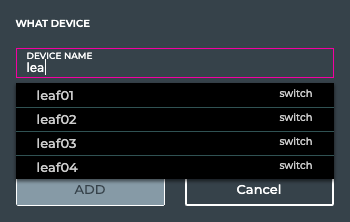
Begin typing the hostname of the device you are interested in. Select it from the suggested matches when it appears.
-
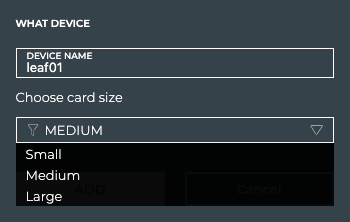
Select small to open the small size card.
-
Click Add, or Cancel to exit the process.
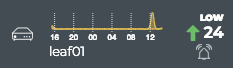
In this example, we see that the leaf01 switch has had very few alarms overall, but the number is trending upward, with a total count of 24 alarms currently.
View Health Performance Metrics
When you are monitoring switches that have been problematic or are newly installed, you might want to view more than a summary. Instead, seeing key performance metrics can help you determine where issues might be occurring or how new devices are functioning in the network.
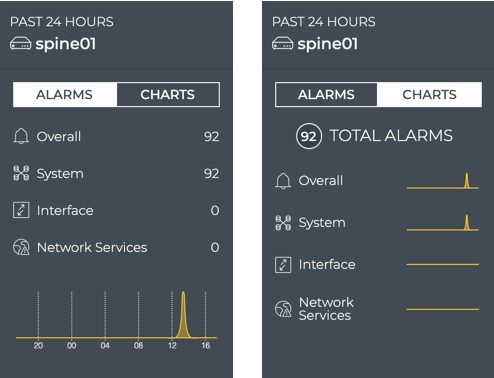
To view the key metrics, open the medium Switch card. The card shows you the overall switch health score and the scores for the key metrics that comprise that score. The key metric scores are based on the number of alarms attributed to the following activities on the switch:
- network services, such as BGP, EVPN, MLAG, NTP, and so forth
- scheduled traces
- interface performance
- platform performance
Also included on the card is the total alarm count for all of these metrics. You can view the key performance metrics as numerical scores or as line charts over time, by clicking Charts or Alarms at the top of the card.
View Attributes of a Switch
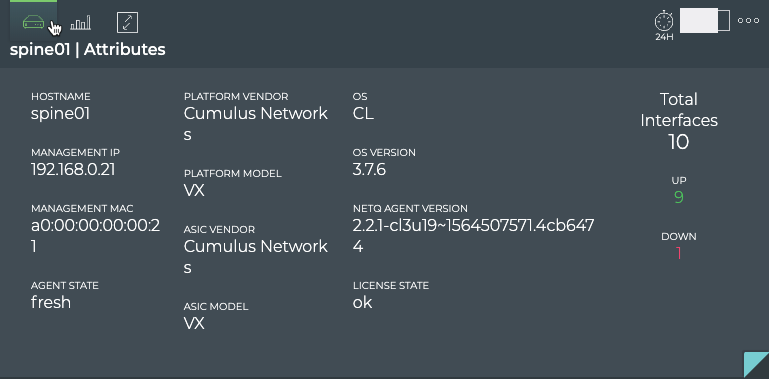
For a quick look at the key attributes of a particular switch, open the large Switch card. Attributes are displayed as the default tab.
In this example, the items of interest might be the five interfaces that are down and what version of OS and NetQ Agent the switch is running.
View Current Resource Utilization for a Switch
The NetQ GUI enables you to easily view the performance of various hardware components and the network tables. This enables you to determine whether a switch is reaching its maximum load and compare its performance with other switches.
To view the resource utilization on a particular switch:
-
Open the large Switch card.
-
Hover over the card and click
 .
. -
The card is divided into two sections, displaying hardware-related performance through a series of charts.
-
Look at the hardware performance charts. Are there any that are reaching critical usage levels?
-
Is usage high at a particular time of day?
-
Change the time period. Is the performance about the same? Better? Worse? The results can guide your decisions about upgrade options.
-
Open a different Switch card for a comparable switch. Is the performance similar?
View Interface Statistics for a Switch
If you suspect that a particular switch is having performance problems, you might want to view the status of its interfaces. The statistics can also provide insight into interfaces that are more heavily loaded than others.
To view interface statistics:
-
Click
 .
. -
Begin typing the name of the switch of interest, and select when it appears in the suggestions list.
-
Select the Large card size.
-
Click Add.
-
Hover over the card and click
 to open the Interface Stats tab.
-
Select an interface from the list, scrolling down until you find it. By default the interfaces are sorted by Name, but you may find it easier to sort by the highest transmit or receive utilization using the filter above the list.
-
The charts update according to your selection. Scroll up and down to view the individual statistics.
What you view next depends on what you see, but a couple of possibilities include:
- Open the full screen card to view details about all of the IP addresses, MAC addresses, and interfaces on the switch.
- Open another switch card to compare performance on a similar interface.
View All Addresses for a Switch
It can be useful to view all of the configured addresses that this switch is using. You can view all IP addresses or all MAC addresses using the full screen Switch card.
To view all IP addresses:
-
Open the full screen Switch card. Click IP addresses.
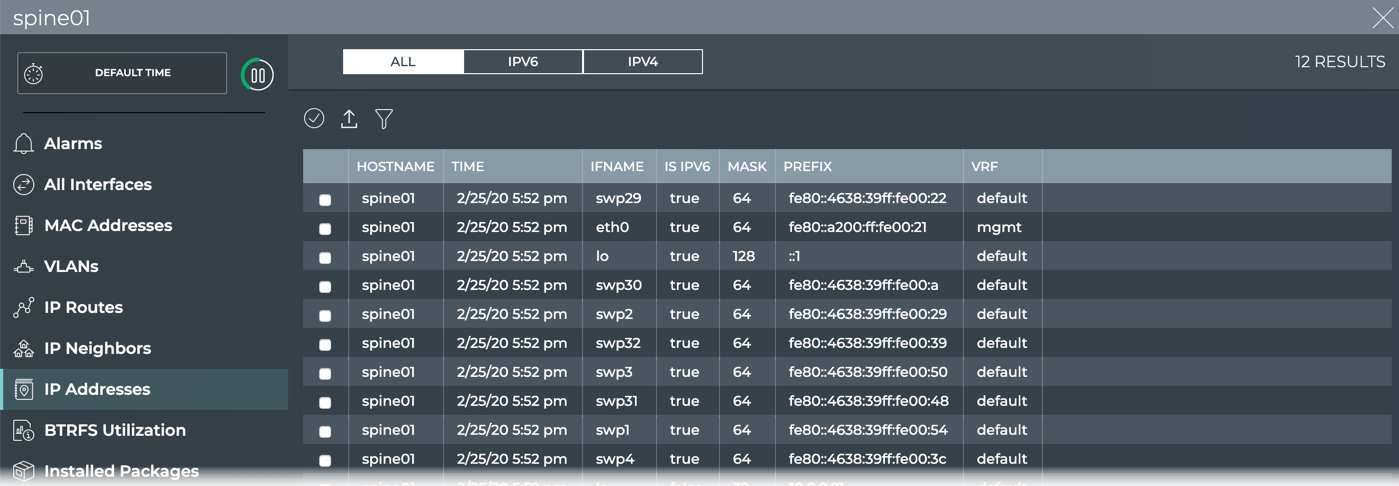
By default All IP addresses are selected. Click IPv6 or IPv4 above the table to view only those IP addresses.
-
Review the addresses for any anomalies, to obtain prefix information, determine if it is an IPv4 or IPv6 address, and so forth.
-
To return to the workbench, click
 in the top right corner.
To view all MAC addresses:
-
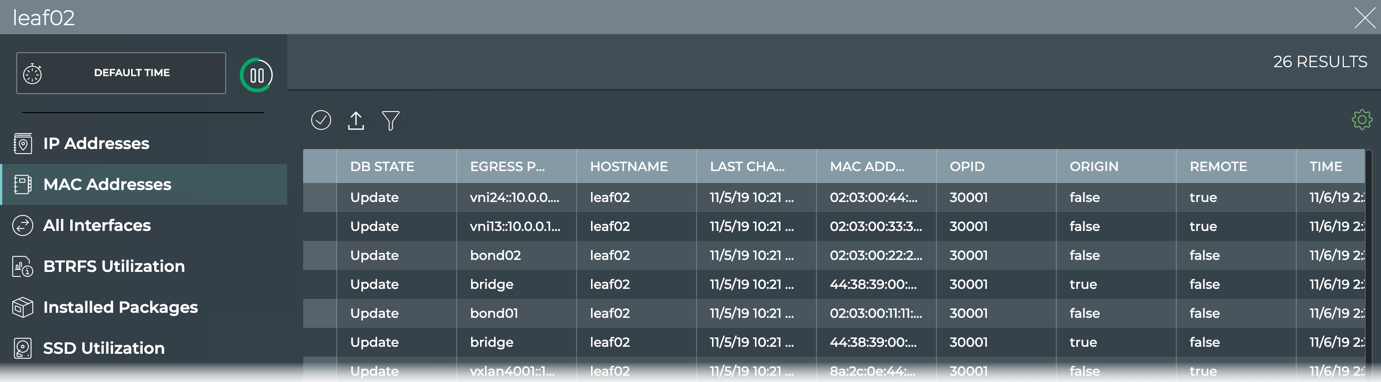
Open the full screen Switch card and click MAC Addresses.
-
Review the addresses for any anomalies, to see the associated egress port, associated VLANs, and so forth.
-
To return to the workbench, click
in the top right corner.
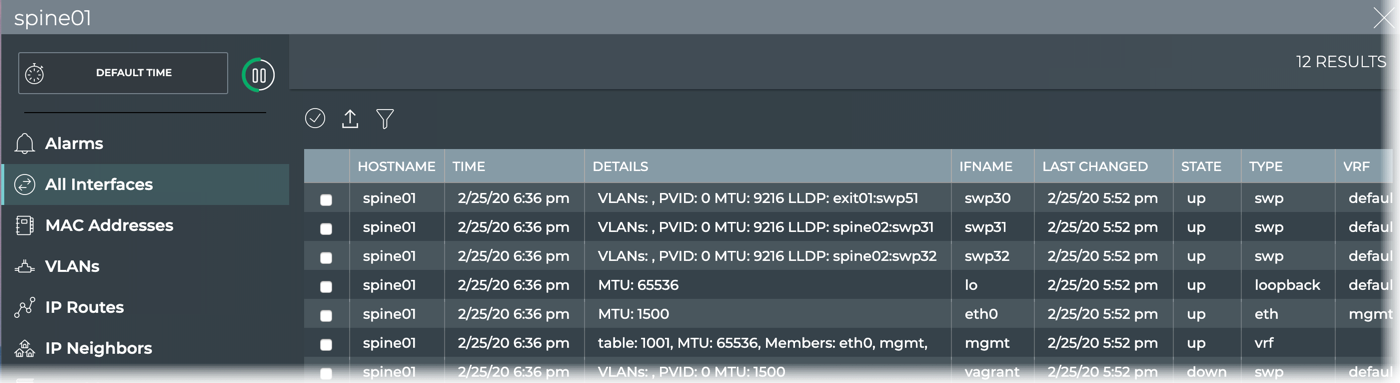
View All Interfaces on a Switch
You can view all of the configured interfaces on a switch in one place making it easier to see inconsistencies in the configuration, quickly see when changes were made, and the operational status.
To view all interfaces:
-
Open the full-screen Switch card and click All Interfaces.
-
Look for interfaces that are down, shown in the State column.
-
Look for recent changes to the interfaces, shown in the Last Changed column.
-
View details about each interface, shown in the Details column.
-
Verify they are of the correct kind for their intended function, shown in the Type column.
-
Verify the correct VRF interface is assigned to an interface, shown in the VRF column.
-
To return to the workbench, click
in the top right corner.
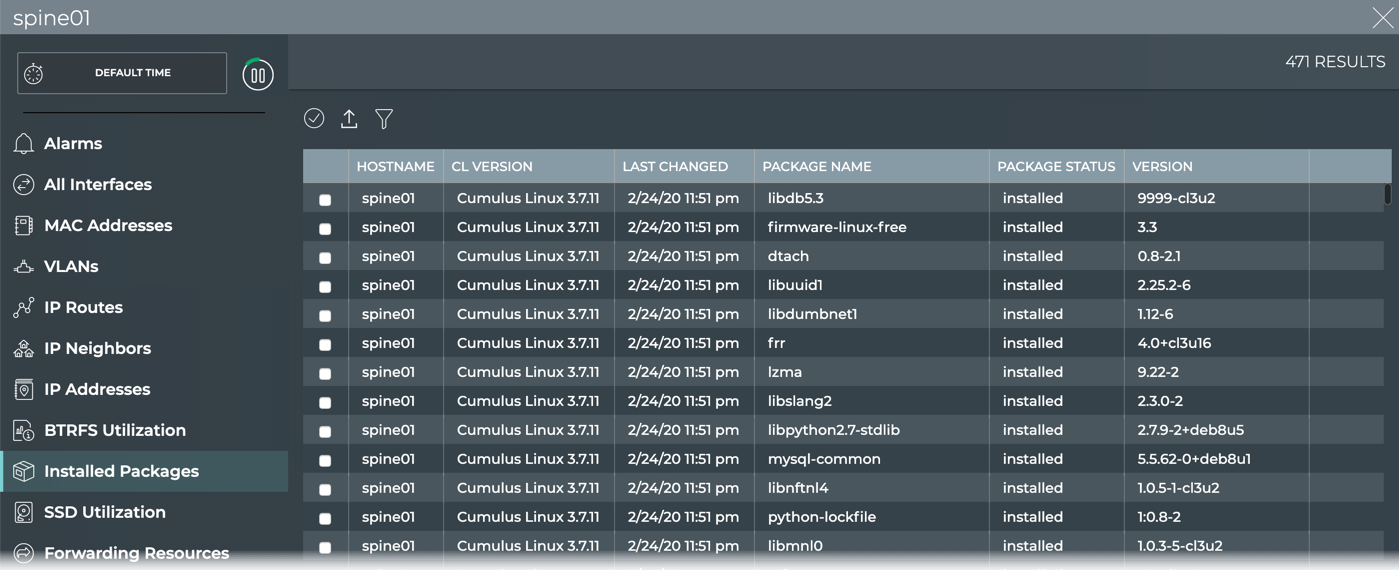
View All Software Packages on a Switch
You can view all of the software installed on a given switch to quickly validate versions and total software installed.
To view all software packages:
-
Open the full-screen Switch card and click Installed Packages.
-
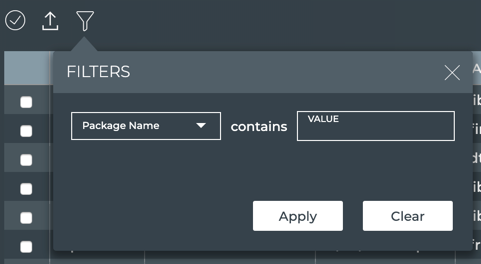
Look for packages of interest and their version and status. Sort by a particular parameter by clicking
 .
.
-
Optionally, export the list by selecting all or specific packages, then clicking
 .
.
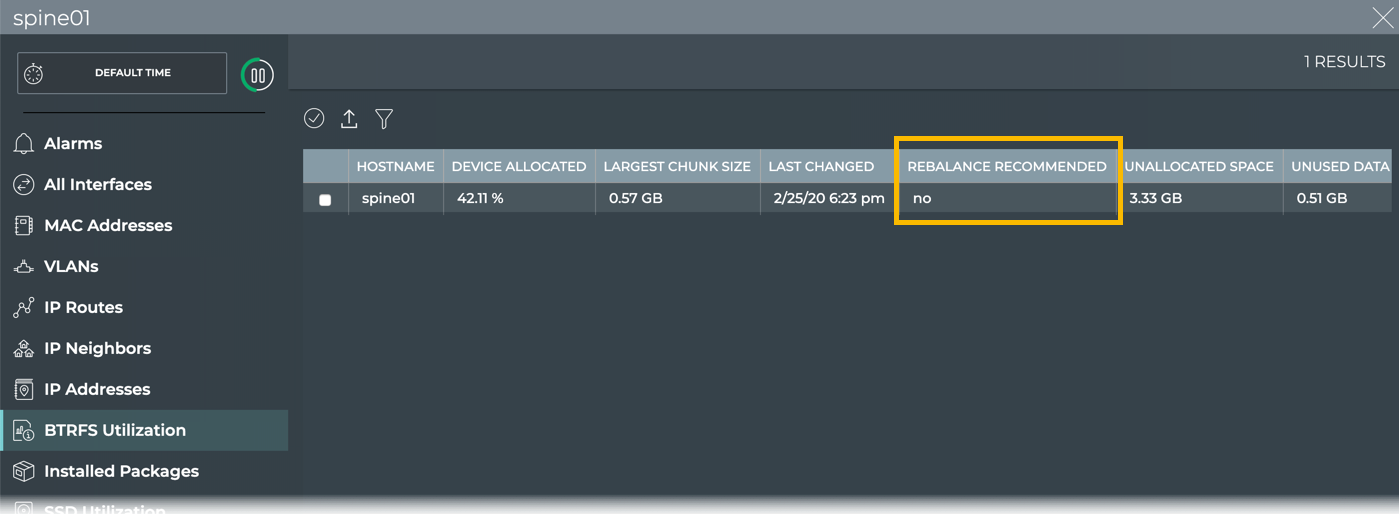
View Disk Storage After BTRFS Allocation
Customers running Cumulus Linux 3.x which uses the BTRFS (b-tree file system) might experience issues with disk space management. This is a known problem of BTRFS because it does not perform periodic garbage collection, or rebalancing. If left unattended, these errors can make it impossible to rebalance the partitions on the disk. To avoid this issue, Cumulus Networks recommends rebalancing the BTRFS partitions in a preemptive manner, but only when absolutely needed to avoid reduction in the lifetime of the disk. By tracking the state of the disk space usage, users can determine when rebalancing should be performed. For details about when a rebalance is recommended, refer to When to Rebalance BTRFS Partitions.
To view the disk state:
-
Open the full-screen Switch card for a switch of interest:
- Type the switch name in the Search box, then use the card size picker to open the full-screen card, or
- Click (Switches) and enter the switch name and select the full-screen card size.
-
Click BTRFS Utilization.
-
Look for the Rebalance Recommended column.
If the value in that column says Yes, then you are strongly encouraged to rebalance the BTRFS partitions. If it says No, then you can review the other values in the table to determine if you are getting close to needing a rebalance, and come back to view this table at a later time.
View SSD Utilization
For NetQ servers and appliances that have 3ME3 solid state drives (SSDs) installed (primarily in on-premises deployments), you can view the utilization of the drive on-demand. An alarm is generated for drives that drop below 10% health, or have more than a two percent loss of health in 24 hours, indicating the need to rebalance the drive. Tracking SSD utiilization over time enables you to see any downward trend or instability of the drive before you receive an alarm.
To view SSD utilization:
-
Open the full screen Switch card and click SSD Utilization.
-
View the average PE Cycles value for a given drive. Is it higher than usual?
-
View the Health value for a given drive. Is it lower than usual? Less than 10%?
Consider adding the switch cards that are suspect to a workbench for easy tracking.
Monitor Switch Component Inventory
Knowing what components are included on all of your switches aids in upgrade, compliance, and other planning tasks. Viewing this data is accomplished through the Switch Inventory card.
Switch Inventory Card Workflow Summary
The small Switch Inventory card displays:
| Item | Description |
|---|---|
| Indicates data is for switch inventory | |
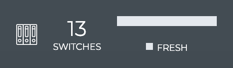
| Count | Total number of switches in the network inventory |
| Chart | Distribution of overall health status during the designated time period; fresh versus rotten |
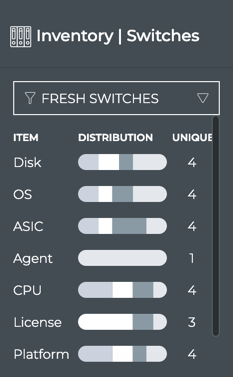
The medium Switch Inventory card displays:
| Item | Description |
|---|---|
| Indicates data is for switch inventory | |
| Filter | View fresh switches (those you have heard from recently) or rotten switches (those you have not heard from recently) on this card |
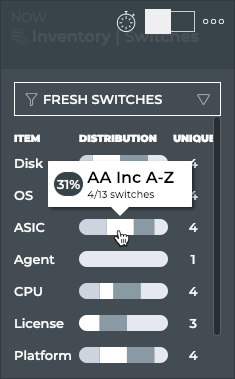
| Chart | Distribution of switch components (disk size, OS, ASIC, NetQ Agents, CPU, Cumulus Linux licenses, platform, and memory size) during the designated time period. Hover over chart segment to view versions of each component. Note: You should only have one version of NetQ Agent running and it should match the NetQ Platform release number. If you have more than one, you likely need to upgrade the older agents. |
| Unique | Number of unique versions of the various switch components. For example, for OS, you might have CL 3.7.1 and CL 3.7.4 making the unique value two. |
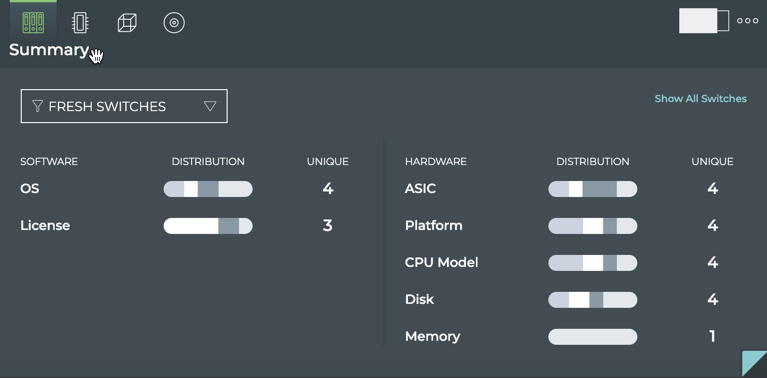
The large Switch Inventory card contains four tabs.
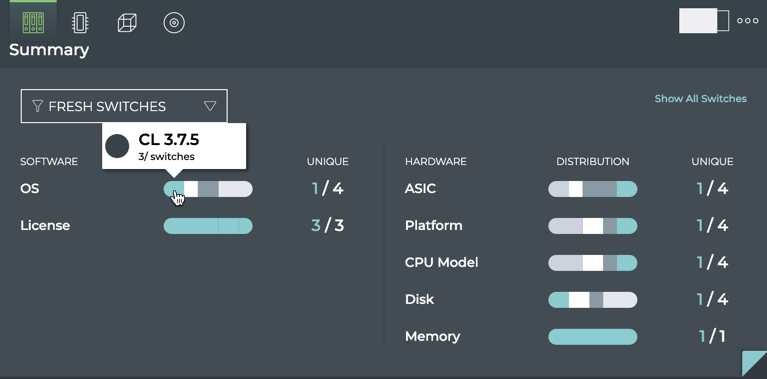
The Summary tab displays:
| Item | Description |
|---|---|
| Indicates data is for switch inventory | |
| Filter | View fresh switches (those you have heard from recently) or rotten switches (those you have not heard from recently) on this card |
| Charts | Distribution of switch components (disk size, OS, ASIC, NetQ Agents, CPU, Cumulus Linux licenses, platform, and memory size), divided into software and hardware, during the designated time period. Hover over chart segment to view versions of each component. Note: You should only have one version of NetQ Agent running and it should match the NetQ Platform release number. If you have more than one, you likely need to upgrade the older agents. |
| Unique | Number of unique versions of the various switch components. For example, for OS, you might have CL 3.7.6 and CL 3.7.4 making the unique value two. |
The ASIC tab displays:
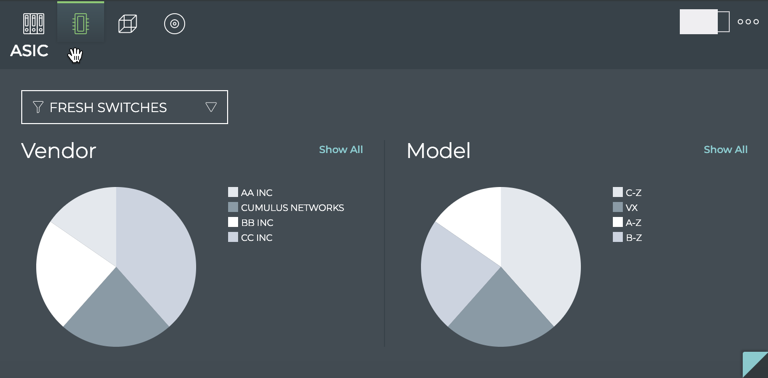
| Item | Description |
|---|---|
| Indicates data is for ASIC information | |
| Filter | View fresh switches (those you have heard from recently) or rotten switches (those you have not heard from recently) on this card |
| Vendor chart | Distribution of ASIC vendors. Hover over chart segment to view the number of switches with each version. |
| Model chart | Distribution of ASIC models. Hover over chart segment to view the number of switches with each version. |
| Show All | Opens full screen card displaying all components for all switches |
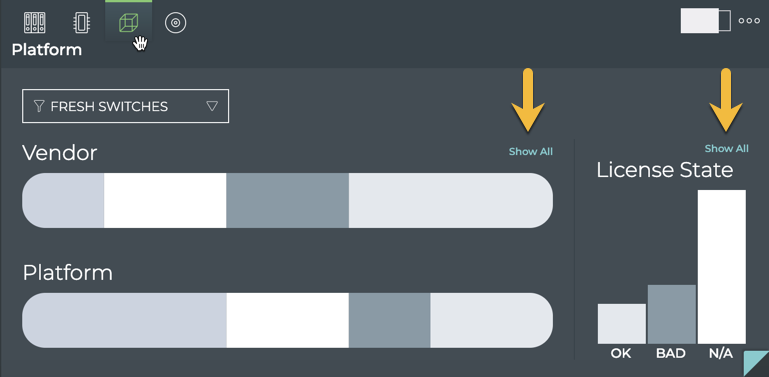
The Platform tab displays:
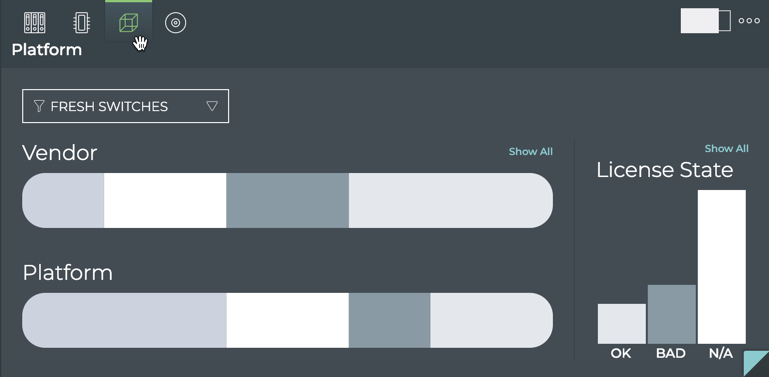
| Item | Description |
|---|---|
| Indicates data is for platform information | |
| Filter | View fresh switches (those you have heard from recently) or rotten switches (those you have not heard from recently) on this card |
| Vendor chart | Distribution of platform vendors. Hover over chart segment to view the number of switches with each vendor. |
| Platform chart | Distribution of platform models. Hover over chart segment to view the number of switches with each model. |
| License State chart | Distribution of Cumulus Linux license status. Hover over chart segments to highlight the vendor and platforms that have that license status. |
| Show All | Opens full screen card displaying all components for all switches |
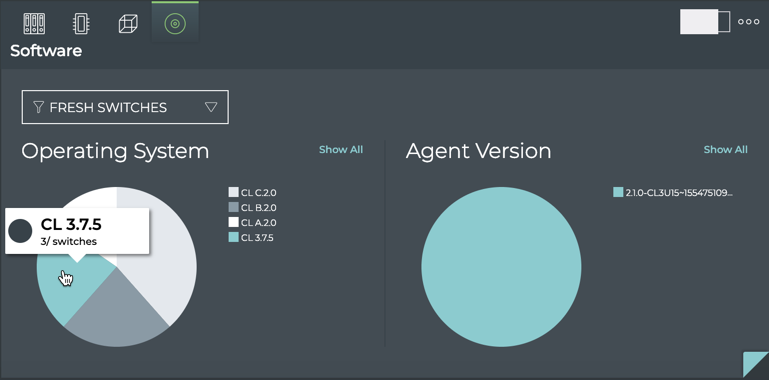
The Software tab displays:
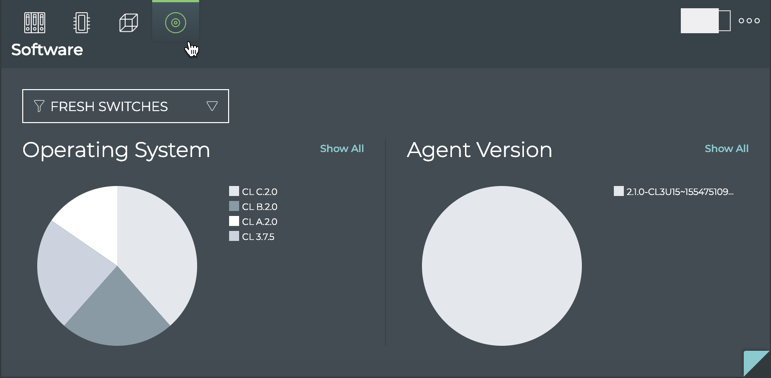
| Item | Description |
|---|---|
| Indicates data is for software information | |
| Filter | View fresh switches (those you have heard from recently) or rotten switches (those you have not heard from recently) on this card |
| Operating System chart | Distribution of OS versions. Hover over chart segment to view the number of switches with each version. |
| Agent Version chart | Distribution of NetQ Agent versions. Hover over chart segment to view the number of switches with each version. Note: You should only have one version of NetQ Agent running and it should match the NetQ Platform release number. If you have more than one, you likely need to upgrade the older agents. |
| Show All | Opens full screen card displaying all components for all switches |
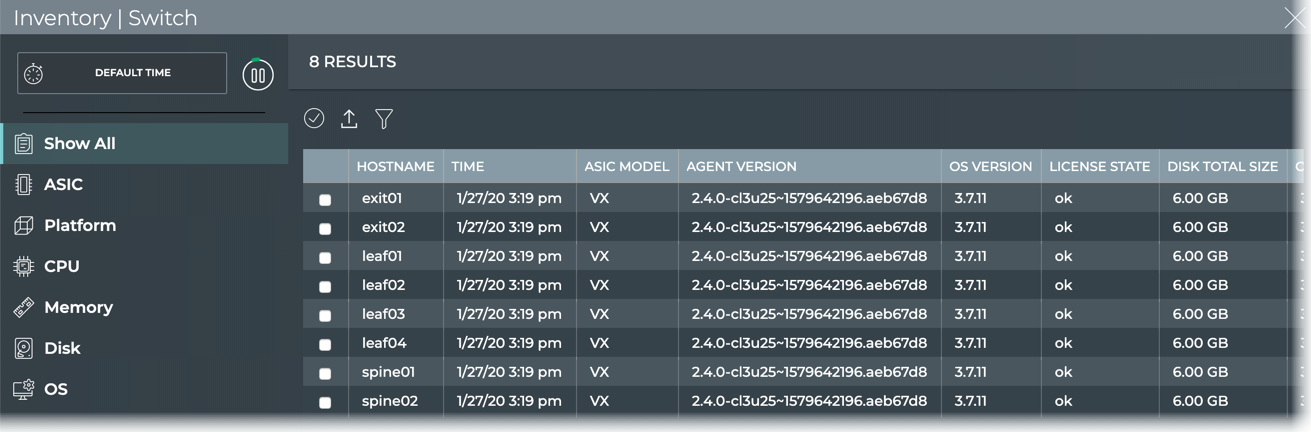
The full screen Switch Inventory card provides tabs for all components, ASIC, platform, CPU, memory, disk, and OS components.
There are a multitude of ways to view and analyze the available data within this workflow. A few examples are provided here.
View a Summary of Communication Status for All Switches
A communication status summary for all of your switches across the network is available from the small Switch Inventory card.
In this example, we see all 13 switches have been heard from recently (they are fresh).
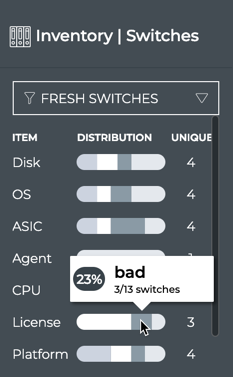
View the Number of Types of Any Component Deployed
For each of the components monitored on a switch, NetQ displays the variety of those component by way of a count. For example, if you have three operating systems running on your switches, say Cumulus Linux, Ubuntu and RHEL, NetQ indicates a total unique count of three OSs. If you only use Cumulus Linux, then the count shows as one.
To view this count for all of the components on the switch:
-
Open the medium Switch Inventory card.
-
Note the number in the Unique column for each component.
In the above example, there are four different disk sizes deployed, four different OSs running, four different ASIC vendors and models deployed, and so forth.
-
Scroll down to see additional components.
By default, the data is shown for switches with a fresh communication status. You can choose to look at the data for switches in the rotten state instead. For example, if you wanted to see if there was any correlation to a version of OS to the switch having a rotten status, you could select Rotten Switches from the dropdown at the top of the card and see if they all use the same OS (count would be 1). It may not be the cause of the lack of communication, but you get the idea.
View the Distribution of Any Component Deployed
NetQ monitors a number of switch components. For each component you can view the distribution of versions or models or vendors deployed across your network for that component.
To view the distribution:
-
Open the medium or large Switch Inventory card. Each component has a chart showing the distribution.
OR
-
Hover over a segment of the chart to view the name, version, model or vendor and the number of switches that have been deployed. You can also see the percentage of all switches this total represents. On the large Switch Inventory card, hovering also highlights the related components for the selected component. This is shown in blue here.
-
Point to additional segments on that component or other components to view their detail.
-
Scroll down to view additional components.
View the Number of Switches with Invalid or Missing Licenses
It is important to know when you have switches that have invalid or missing Cumulus Linux licenses, as not all of the features are operational without a valid license. Simply open the medium or large Switch Inventory card, and hover over the License chart to see the count.
To view which vendors and platforms have bad or missing licenses, open the large Switch Inventory card, and click ![]() to open the Platform tab. Hover over the License State bar chart to highlight the vendor and platforms with the various states.
to open the Platform tab. Hover over the License State bar chart to highlight the vendor and platforms with the various states.
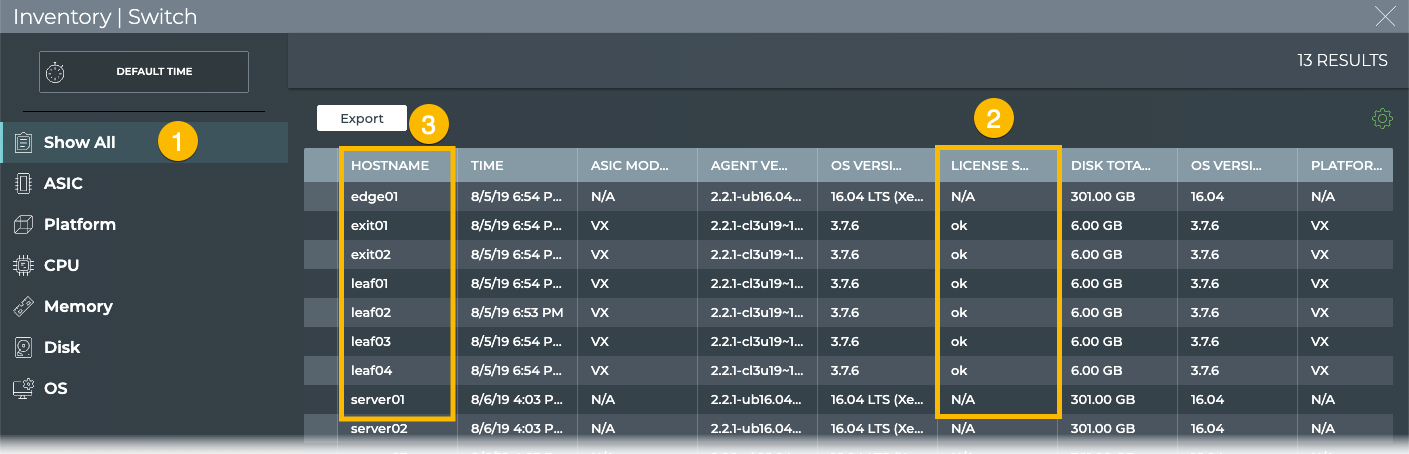
To view which switches have invalid or missing licenses, either:
- Hover over the large Switch Inventory card and click
 to open the Platform tab. Above the Licenses State or the Vendor chart, click Show All.
- Open the full screen Switch Inventory card. Then sort the All Switches tab data table by the License State column to locate the switches with bad or missing licenses.
View the Most Commonly Deployed ASIC
It can be useful to know the quantity and ratio of many components deployed in your network to determine the scope of upgrade tasks, balance vendor reliance, or for detailed troubleshooting. You can view the most commonly deployed components in generally the same way. Some components have additional details contained in large card tabs.
To view the most commonly deployed ASIC, for example:
-
Open the medium or large Switch Inventory card.
-
Hover over the largest segment in the ASIC chart. The tooltip that appears shows you the number of switches with the given ASIC and the percentage of your entire switch population with this ASIC.
Click on any other component in a similar fashion to see the most common type of that component.
-
If you opened the medium Switch Inventory card, switch to the large card.
-
Hover over the card, and click
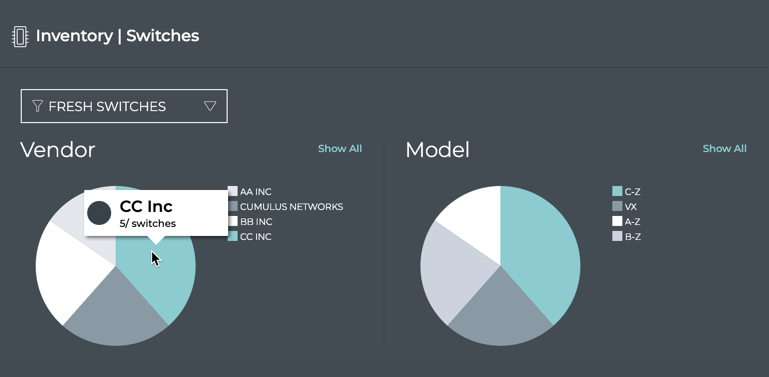
 to open the ASIC tab. Here you can more easily view the various vendors and platforms based on the ASIC deployed.
 -
Hover over the Vendor pie chart to highlight which platforms are supported by the vendor and vice versa; hover over the Model pie chart to see which vendor supports that platform. Moving your cursor off of the charts removes the highlight.
-
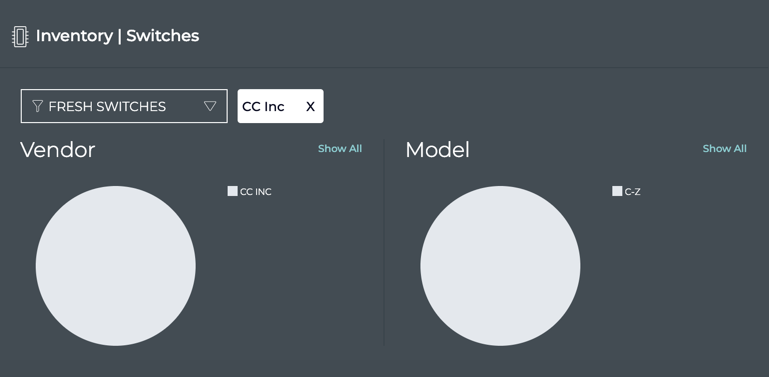
Click on a segment of the Vendor pie chart to drill down and see only that Vendor and its supported models. A filter tag is placed at the top of the charts.
-
To return to the complete view of vendors and platforms, click
on the filter tag.
View the Number of Switches with a Particular NetQ Agent
It is recommended that when you upgrade NetQ that you also upgrade the NetQ Agents. You can determine if you have covered all of your agents using the medium or large Switch Inventory card. To view the NetQ Agent distribution by version:
-
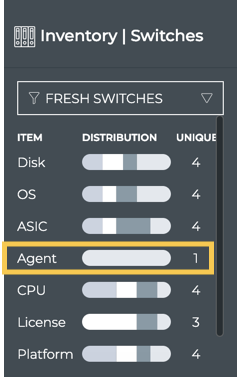
Open the medium Switch Inventory card.
-
View the number in the Unique column next to Agent.
-
If the number is greater than one, you have multiple NetQ Agent versions deployed.
-
If you have multiple versions, hover over the Agent chart to view the count of switches using each version.
-
For more detail, switch to the large Switch Inventory card.
-
Hover over the card and click
 to open the Software tab.
-
Hover over the chart on the right to view the number of switches using the various versions of the NetQ Agent.
-
Hover over the Operating System chart to see which NetQ Agent versions are being run on each OS.
-
Click either chart to focus on a particular OS or agent version.
-
To return to the full view, click
in the filter tag. -
Filter the data on the card by switches that are having trouble communicating, by selecting Rotten Switches from the dropdown above the charts.
View a List of All Data for a Specific Component
When the small, medium and large Switch Inventory cards do not provide either enough information or are not organized in a fashion that provides the information you need, open the full screen Switch Inventory card. Select the component tab of interest and filter and sort as desired. Export the data to a third-party tool, by clicking ![]() .
.