Investigate NetQ Issues
Monitoring of systems inevitably leads to the need to troubleshoot and resolve the issues found. In fact network management follows a common pattern as shown in this diagram.
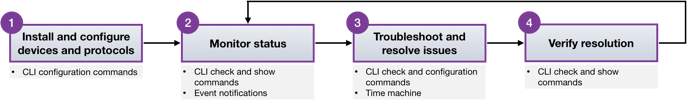
This topic describes some of the tools and commands you can use to troubleshoot issues with the network and NetQ itself. Some example scenarios are included here:
- viewing configuration and log files,
- verifying NetQ Agent health,
- investigating recent events, and
- investigating events from the past
- running a trace.
Try looking at the specific protocol or service, or particular devices as well. If none of these produce a resolution, you can capture a log to use in discussion with the Cumulus Networks support team.
Browse Configuration and Log Files
To aid in troubleshooting issues with NetQ, there are the following configuration and log files that can provide insight into the root cause of the issue:
| File | Description |
|---|---|
/etc/netq/netq.yml |
The NetQ configuration file. This file appears only if you installed either the netq-apps package or the NetQ Agent on the system. |
/var/log/netqd.log |
The NetQ daemon log file for the NetQ CLI. This log file appears only if you installed the netq-apps package on the system. |
/var/log/netq-agent.log |
The NetQ Agent log file. This log file appears only if you installed the NetQ Agent on the system. |
Check NetQ Agent Health
Checking the health of the NetQ Agents is a good way to start troubleshooting NetQ on your network. If any agents are rotten, meaning three heartbeats in a row were not sent, then you can investigate the rotten node. In the example below, the NetQ Agent on server01 is rotten, so you know where to start looking for problems:
    cumulus@switch:$ netq check agents
    Checked nodes: 12,

    Rotten nodes: 1
    netq@446c0319c06a:/$ netq show agents
    Node      Status    Sys Uptime    Agent Uptime
    --------  --------  ------------  --------------
    exit01
    Fresh
         8h ago        4h ago
    exit02
    Fresh
         8h ago        4h ago
    leaf01
    Fresh
         8h ago        4h ago
    leaf02
    Fresh
         8h ago        4h ago
    leaf03
    Fresh
         8h ago        4h ago
    leaf04
    Fresh
         8h ago        4h ago
    server01
    Rotten
        4h ago        4h ago
    server02
    Fresh
         4h ago        4h ago
    server03
    Fresh
         4h ago        4h ago
    server04
    Fresh
         4h ago        4h ago
    spine01
    Fresh
         8h ago        4h ago
    spine02
    Fresh
         8h ago        4h ago
Diagnose an Event after It Occurs
NetQ provides users with the ability to go back in time to replay the network state, see fabric-wide event change logs and root cause state deviations. The NetQ Telemetry Server maintains data collected by NetQ agents in a time-series database, making fabric-wide events available for analysis. This enables you to replay and analyze network-wide events for better visibility and to correlate patterns. This allows for root-cause analysis and optimization of network configs for the future.
NetQ provides a number of commands for diagnosing past events.
NetQ records network events and stores them in its database. You can
view the events through a third-party notification application like
PagerDuty or Slack or use netq show events to look for any changes
made to the runtime configuration that may have triggered the alert,
then use netq trace to track the connection between the nodes.
The netq trace command traces the route of an IP or MAC address from
one endpoint to another. It works across bridged, routed and VXLAN
connections, computing the path using available data instead of sending
real traffic - this way, it can be run from anywhere. It performs MTU
and VLAN consistency checks for every link along the path.
For example, say you get an alert about a BGP session failure. You can
quickly run netq check bgp to determine what sessions failed:
cumulus@switch:~$ netq check bgp
Total Nodes: 25, Failed Nodes: 3, Total Sessions: 220 , Failed Sessions: 24,
Hostname          VRF             Peer Name         Peer Hostname     Reason                                        Last Changed
----------------- --------------- ----------------- ----------------- --------------------------------------------- -------------------------
exit-1            DataVrf1080     swp6.2            firewall-1        BGP session with peer firewall-1 swp6.2: AFI/ 1d:7h:56m:9s
                                                                      SAFI evpn not activated on peer
exit-1            DataVrf1080     swp7.2            firewall-2        BGP session with peer firewall-2 (swp7.2 vrf  1d:7h:49m:31s
                                                                      DataVrf1080) failed,
                                                                      reason: Peer not configured
exit-1            DataVrf1081     swp6.3            firewall-1        BGP session with peer firewall-1 swp6.3: AFI/ 1d:7h:56m:9s
                                                                      SAFI evpn not activated on peer
exit-1            DataVrf1081     swp7.3            firewall-2        BGP session with peer firewall-2 (swp7.3 vrf  1d:7h:49m:31s
                                                                      DataVrf1081) failed,
                                                                      reason: Peer not configured
You can run a trace from spine01 to leaf02, which has the IP address 10.1.20.252:
cumulus@switch:~$ netq trace 10.1.20.252 from spine01 around 5m
spine01 -- spine01:swp1 -- leaf01:vlan20
        -- spine01:swp2 -- leaf02:vlan20
Then you can check what’s changed on the network to help you identify the problem.
cumulus@switch:~$ netq show events type bgp
Matching events records:
Hostname          Message Type Severity Message                             Timestamp
----------------- ------------ -------- ----------------------------------- -------------------------
leaf21            bgp          info     BGP session with peer spine-1 swp3. 1d:8h:35m:19s
                                        3 vrf DataVrf1081 state changed fro
                                        m failed to Established
leaf21            bgp          info     BGP session with peer spine-2 swp4. 1d:8h:35m:19s
                                        3 vrf DataVrf1081 state changed fro
                                        m failed to Established
leaf21            bgp          info     BGP session with peer spine-3 swp5. 1d:8h:35m:19s
                                        3 vrf DataVrf1081 state changed fro
                                        m failed to Established
leaf21            bgp          info     BGP session with peer spine-1 swp3. 1d:8h:35m:19s
                                        2 vrf DataVrf1080 state changed fro
                                        m failed to Established
leaf21            bgp          info     BGP session with peer spine-3 swp5. 1d:8h:35m:19s
                                        2 vrf DataVrf1080 state changed fro
                                        m failed to Established
...
Use NetQ as a Time Machine
With NetQ, you can travel back to a specific point in time or a range of times to help you isolate errors and issues.
For example, if you think you had an issue with your sensors last night, you can check the sensors on all your nodes around the time you think the issue occurred:
cumulus@leaf01:~$ netq check sensors around 12h
Total Nodes: 25, Failed Nodes: 0, Checked Sensors: 221, Failed Sensors: 0
Or you can specify a range of times using the between option. The
units of time you can specify are second (s), minutes (m), hours
(h) and days (d). Always specify the most recent time first, then
the more distant time. For example, to see the changes made to the
network between the past minute and 5 minutes ago, you’d run:
cumulus@switch:/$ netq show events between now and 48h
Matching events records:
Hostname          Message Type Severity Message                             Timestamp
----------------- ------------ -------- ----------------------------------- -------------------------
leaf21            configdiff   info     leaf21 config file ptm was modified 1d:8h:38m:6s
leaf21            configdiff   info     leaf21 config file lldpd was modifi 1d:8h:38m:6s
                                        ed
leaf21            configdiff   info     leaf21 config file interfaces was m 1d:8h:38m:6s
                                        odified
leaf21            configdiff   info     leaf21 config file frr was modified 1d:8h:38m:6s
leaf12            configdiff   info     leaf12 config file ptm was modified 1d:8h:38m:11s
leaf12            configdiff   info     leaf12 config file lldpd was modifi 1d:8h:38m:11s
                                        ed
leaf12            configdiff   info     leaf12 config file interfaces was m 1d:8h:38m:11s
                                        odified
leaf12            configdiff   info     leaf12 config file frr was modified 1d:8h:38m:11s
leaf11            configdiff   info     leaf11 config file ptm was modified 1d:8h:38m:22s
...
You can travel back in time 5 minutes and run a trace from spine02 to exit01, which has the IP address 27.0.0.1:
cumulus@leaf01:~$ netq trace 27.0.0.1 from spine02 around 5m
Detected Routing Loop. Node exit01 (now via Local Node exit01 and Ports swp6 <==> Remote  Node/s spine01 and Ports swp3) visited twice.
Detected Routing Loop. Node spine02 (now via mac:00:02:00:00:00:15) visited twice.
spine02 -- spine02:swp3 -- exit01:swp6.4 -- exit01:swp3 -- exit01
                        -- spine02:swp7  -- spine02
Trace Paths in a VRF
The netq trace command works with VRFs as well:
cumulus@leaf01:~$ netq trace 10.1.20.252 from spine01 vrf default around 5m
spine01 -- spine01:swp1 -- leaf01:vlan20
        -- spine01:swp2 -- leaf02:vlan20
Generate a Support File
The opta-support command generates an archive of useful information
for troubleshooting issues with NetQ. It is an extension of the
cl-support command in Cumulus Linux. It provides information about the
NetQ Platform configuration and runtime statistics as well as output
from the docker ps command. The Cumulus Networks support team may
request the output of this command when assisting with any issues that
you could not solve with your own troubleshooting. Run the following
command:
cumulus@switch:~$ opta-support